Last updated on August 22, 2025
Multi-panel plots or small multiples are a great way visualize the relationship between two variables with respect ot the values of other variables. Seaborn offers a few different ways to make a multi-panel plots, with FacetGrid is the class behind multi-panel plots in Seaborn.
In this post, we will see how can we customize the titles of each of the small multiple in a multi-panel plot made with Seborn’s displot() function. Michael Waskom, the creator of Seaborn shared a really neat trick on twitter to change the titles of small multiples made with Seaborn’s displot(). Here we illustrate the example step-by-btep to customize the titles.
👉 Want more? Explore the full Seaborn Tutorial Hub with 35+ examples, code recipes, and best practices.
Let us first load the modules needed and make sure we have Seaborn version 0.11+.
import seaborn as sns
import matplotlib.pyplot as plt
print(sns.__version__)
'0.11.0'
We will use penguin dataset available as part Seaborn to make multi-grid plot.
penguins = sns.load_dataset("penguins")
penguins.head()


species	island	bill_length_mm	bill_depth_mm	flipper_length_mm	body_mass_g	sex
0	Adelie	Torgersen	39.1	18.7	181.0	3750.0	Male
1	Adelie	Torgersen	39.5	17.4	186.0	3800.0	Female
2	Adelie	Torgersen	40.3	18.0	195.0	3250.0	Female
3	Adelie	Torgersen	NaN	NaN	NaN	NaN	NaN
4	Adelie	Torgersen	36.7	19.3	193.0	3450.0	Female
Multi-panel histograms with Seaborn displot()
Seaborn’s displot() function makes it easy to visualize “univariate or bivariate distribution” of data. We can also easily subset the data based on other variables to make a facetting across small multiples.
The basic idea is to use “row”, “col” and “hue” as argument to displot() add additional variables on visualization. In this example, we use “row” and “col” to create multi-panel or multi-grid plots of distribution of one numerical variable.
sns.displot(data=penguins,
            x="bill_length_mm",
            row="sex",
            col="species",
            height=3.5)
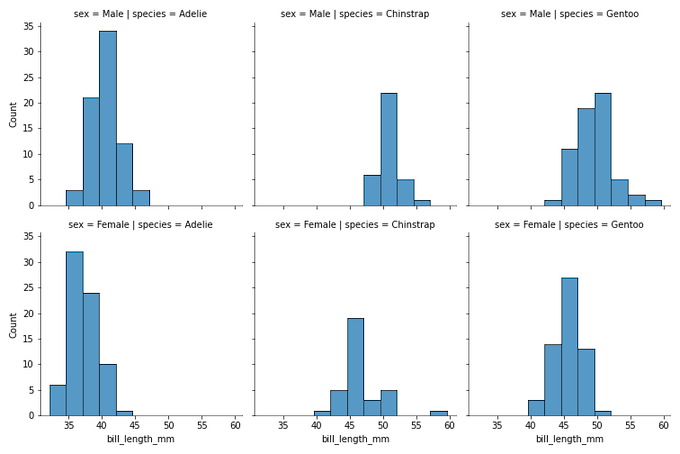
Seaborn’s displot() makes histogram by default using kind=”hist” argument. We can see that we have histograms of bill length for sex on rows and species on columns.
We can also see that the titles of each small-multiple shows the specific group the plot corresponds to.
Customizing Multi-panel histograms’ title
In this post, we will customize the title and make it simpler to understand the plot. We will also add the number of samples in each of the sub-groups in the title.
Let us first compute the number of samples in each subgroup, i.e. sex-species. Pandas’ groupby() and size() functions can get us the counts per each species and sex.
counts=penguins.groupby(["sex","species"]).size()
counts

sex     species
Female  Adelie       73
        Chinstrap    34
        Gentoo       58
Male    Adelie       73
        Chinstrap    34
        Gentoo       61
dtype: int64
One of the ways to customize the titles is to access the Seaborn plot’s axes information. We can get that by saving the plot into a variable and using axex_dict() function to get all the title information generated by Seaborn’s displot() function. We can see that the dictionary contains the sex and species tuple as keys and the title as values.
g =sns.displot(penguins,
               x="bill_length_mm",
               row="sex",
               col="species",
               height=3.5)
g.axes_dict

{('Male',
  'Adelie'): <AxesSubplot:title={'center':'sex = Male | species = Adelie'}, ylabel='Count'>,
 ('Male',
  'Chinstrap'): <AxesSubplot:title={'center':'sex = Male | species = Chinstrap'}>,
 ('Male',
  'Gentoo'): <AxesSubplot:title={'center':'sex = Male | species = Gentoo'}>,
 ('Female',
  'Adelie'): <AxesSubplot:title={'center':'sex = Female | species = Adelie'}, xlabel='bill_length_mm', ylabel='Count'>,
 ('Female',
  'Chinstrap'): <AxesSubplot:title={'center':'sex = Female | species = Chinstrap'}, xlabel='bill_length_mm'>,
 ('Female',
  'Gentoo'): <AxesSubplot:title={'center':'sex = Female | species = Gentoo'}, xlabel='bill_length_mm'>}
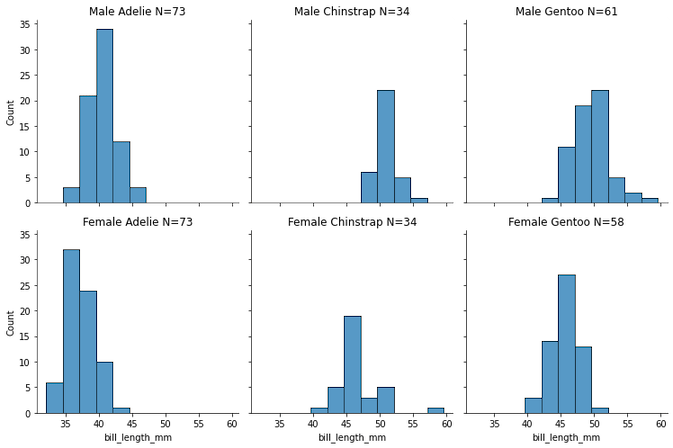
Then we can use for loop to loop through each pair of sex and species and change the title we need using set_title() function as shown below.
g =sns.displot(penguins,
               x="bill_length_mm",
               row="sex",
               col="species",
               height=3.5)
for (row_key, col_key),ax in g.axes_dict.items():
    ax.set_title(f"{row_key} {col_key} N={counts[(row_key, col_key)]}")
plt.savefig("Customize_displot_facetgrid_plot_titles_Python.png")
Now we have much cleaner titles for each of the plots in the multi-plot as we wanted.