
Violinplots are a great alternative to boxplot, as it combines boxplot and density plot. In this tutorial, we will see examples of how to make violinplots with using ggplot2's geom_violin() function. Violinplots are like boxplot for visualizing numerical distributions for … [Read more...] about How To Make Violinplot with Data Points in R?
Violin plot ggplot2
Violinplot vs Boxplot: Why Violinplot Is Better Than Boxplot
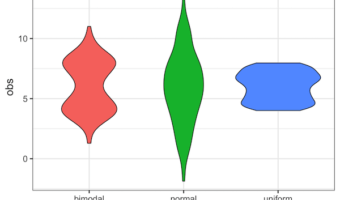
Violinplot or boxplot? What is better? Boxplots is great visualization to show a numerical variable. A boxplot shows "four main features about a variable: center, spread, asymmetry, and outliers". With the five summary statistics one can easily draw boxplot even by hand. Violin … [Read more...] about Violinplot vs Boxplot: Why Violinplot Is Better Than Boxplot
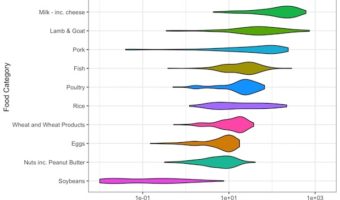
How To Make Grouped Violinplot with ggplot2 in R?

In this tutorial, we will see examples of how to make grouped violinplots using ggplot2's geom_violin() function. Violinplots are like boxplot for visualizing numerical distributions for multiple groups. In comparison to boxplot, Violin plot adds information about density of … [Read more...] about How To Make Grouped Violinplot with ggplot2 in R?
How To Make Violin Plots with ggplot2 in R?
Violin plots are a way visualize numerical variables from one or more groups. Violin plots are similar to box plots. A boxplot shows a numerical distribution using five summary level statistics. Violin plots have the density information of the numerical variables in addition to … [Read more...] about How To Make Violin Plots with ggplot2 in R?