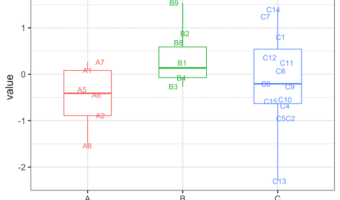
Boxplots with overlayed data points is a great way visualize multiple distributions. One of the biggest benefits of adding data points over the boxplot is that we can actually see the underlying data instead of just the summary stat level data visualization. Sometimes using text … [Read more...] about How To Make Boxplots with Text as Points in R using ggplot2?
R
How to Add Vertical Lines By a Variable in Multiple Density Plots with ggplot2

Adding vertical line or lines at mean or median of density plot can help us understand the trend in the data. When you make multiple density plots adding vertical mean/median line for each group in the same color as the density plot is of great help. In this post, we will see … [Read more...] about How to Add Vertical Lines By a Variable in Multiple Density Plots with ggplot2
How To Make Boxplots in base R?
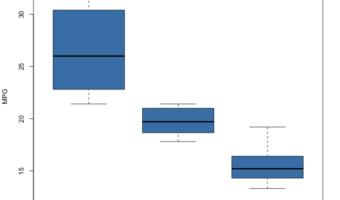
In this post, we will learn how to make simple boxplots using base R function boxplot(). We will use mtcars dataset available readily in R to first make a simple boxplot using boxplot() function in base R. And then we will learn how to customize the boxplot with specifying x and … [Read more...] about How To Make Boxplots in base R?
How to Make Horizontal Boxplot with ggplot2 version 3.3.0?

Making a boxplot or barplot horizontally can be useful in a variety of scenarios. In ggplot2, till now the only way to make a plot horizontal is to use flip the axis using coord_flip(). With ggplot2 version 3.3.0, we can easily flip axis and make horizontal boxplot or horizontal … [Read more...] about How to Make Horizontal Boxplot with ggplot2 version 3.3.0?
How to Color Boxplots with R Colorbrewer Color Palettes?
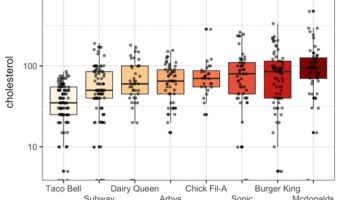
Adding right colors to the plots greatly help convey the main message of the plot. Adding colors manually can be a bit challenging. Color palettes available from RColorBrewer package make it easy add right set of colors to plots made with ggplo2. In this tutorial, we will see … [Read more...] about How to Color Boxplots with R Colorbrewer Color Palettes?