• Skip to primary navigation
  • Skip to main content
  • Skip to primary sidebar

Data Viz with Python and R

Learn to Make Plots in Python and R

  • Home
  • Seaborn
  • Matplotlib
  • ggplot2
  • Altair
  • About
    • Privacy Policy
  • Visualizing Activation Functions in Neural Networks
  • Confusion Matrix Calculator
  • Visualizing Dropout Rate in Neural Network
  • Visualizing Loss Functions in Neural Networks
  • Show Search
Hide Search

ggplot2 version 2.3.0

How To Avoid Overlapping Labels in ggplot2?

datavizpyr · March 11, 2020 ·

Dodge Overlapping X-axis Text with guide_axis() in ggplot2 3.3.0

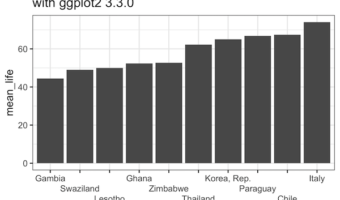
A common problem in making plots, say a barplot or boxplot with a number of groups is that, names of the groups on x-axis label often overlap with each other. Till now, one of the solutions to avoid overlapping text x-axis is to swap x and y axis with coord_flip() and make a … [Read more...] about How To Avoid Overlapping Labels in ggplot2?

Filed Under: Dodge Overlapping Axis Text, ggplot2, ggplot2 version 2.3.0, R Tagged With: dodge labels R

Primary Sidebar

Python & R Viz Hubs

  • Seaborn Guide & Cookbook
  • ggplot2 Guide & Cookbook
  • Matplotlib Guide & Cookbook
  • Confusion Matrix Calculator
  • Visualizing Activation Functions
  • Visualizing Dropout
  • Visualizing Loss Functions

Buy Me a Coffee

Copyright © 2026 · Daily Dish Pro on Genesis Framework · WordPress · Log in

Go to mobile version