• Skip to primary navigation
  • Skip to main content
  • Skip to primary sidebar

Data Viz with Python and R

Learn to Make Plots in Python and R

  • Home
  • Seaborn
  • Matplotlib
  • ggplot2
  • Altair
  • About
    • Privacy Policy
  • Visualizing Activation Functions in Neural Networks
  • Confusion Matrix Calculator
  • Visualizing Dropout Rate in Neural Network
  • Visualizing Loss Functions in Neural Networks
  • Show Search
Hide Search

ggdist

How to make rain cloud plots with ggdist

datavizpyr · August 3, 2022 ·

Rain cloud plots with ggdist

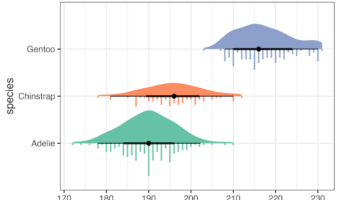
In this tutorial, we will learn how to make raincloud plots with the R package ggdist. In an earlier post, we learned how to make rain cloud plots with half violinplot, kind of from scratch. However, ggdist, an R package "that provides a flexible set of ggplot2 geoms and stats … [Read more...] about How to make rain cloud plots with ggdist

Filed Under: ggdist, ggplot2, R Tagged With: ggdist ggplot2 extension package, rain cloud plots with ggdist

Primary Sidebar

Python & R Viz Hubs

  • Seaborn Guide & Cookbook
  • ggplot2 Guide & Cookbook
  • Matplotlib Guide & Cookbook
  • Confusion Matrix Calculator
  • Visualizing Activation Functions
  • Visualizing Dropout
  • Visualizing Loss Functions

Buy Me a Coffee

Copyright © 2026 · Daily Dish Pro on Genesis Framework · WordPress · Log in

Go to mobile version