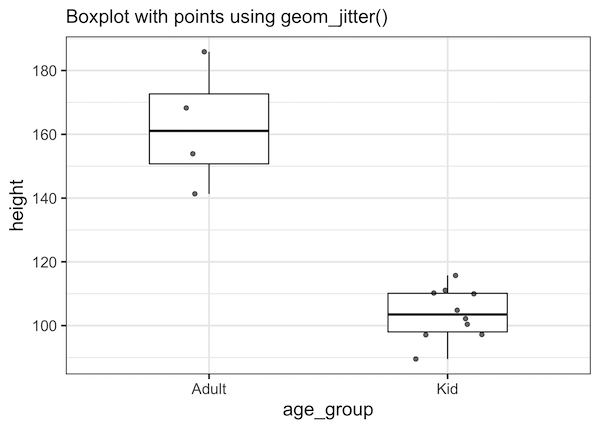
Boxplots with data points are a great way to visualize multiple distributions at the same time without losing any information about the data. In this tutorial, we will see examples of making Boxplots with data points using ggplot2 in R and customize the boxplots with data points. Let us load all the packages in tidyverse… Continue reading How To Make Boxplots with Data Points in R using ggplot2?
Category: Boxplot ggplot2
How to Make Boxplots with ggplot2 in R?
A boxplot is one of the simplest ways to summarize and visualize a distribution. Boxplots have been around for close to 50 years. The earliest form of Boxplot was invented by Mary Eleanor Spear as range plot and then John Tukey created box-and-whisker plot that uses quartiles of a distribution draw a box and whiskers.… Continue reading How to Make Boxplots with ggplot2 in R?
