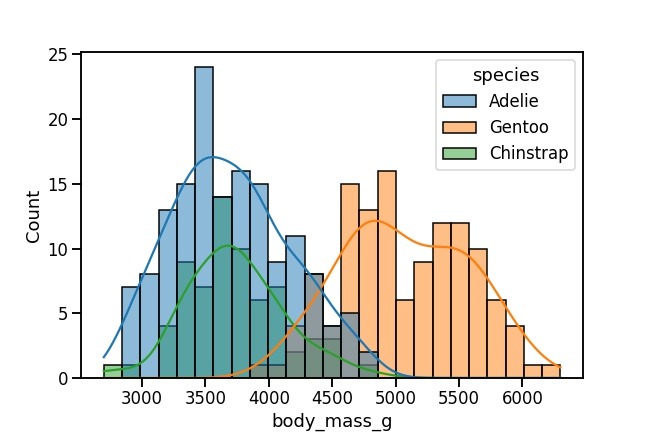
In this tutorial, we will see how to make a histogram with a density line using Seaborn in Python. With Seaborn version 0.11.0, we have a new function histplot() to make histograms. Here, we will learn how to use Seaborn’s histplot() to make a histogram with density line first and then see how how to… Continue reading How to Make Histograms with Density Plots with Seaborn histplot?
