• Skip to primary navigation
  • Skip to main content
  • Skip to primary sidebar

Data Viz with Python and R

Learn to Make Plots in Python and R

  • Home
  • Seaborn
  • Matplotlib
  • ggplot2
  • Altair
  • About
    • Privacy Policy
  • Visualizing Activation Functions in Neural Networks
  • Confusion Matrix Calculator
  • Visualizing Dropout Rate in Neural Network
  • Visualizing Loss Functions in Neural Networks
  • Show Search
Hide Search

Seaborn Boxplot

How to Make Boxplots with Data Points using Seaborn in Python

datavizpyr · December 29, 2019 ·

Colored Boxplot with Bigger Points Using Seaborn

Boxplot with data points on top of it is often better visualization technique than the boxplots alone. This is mainly because, boxplot with data points actually shows the data underlying the boxplots, while the boxplot alone just shows the summary statistics. Always remember, … [Read more...] about How to Make Boxplots with Data Points using Seaborn in Python

Filed Under: Boxplot with points Seaborn, Python, Python Boxplot, Seaborn, Seaborn Boxplot Tagged With: boxplot python, Python boxplot with points, Seaborn Boxplot

Coloring Boxplots with Seaborn Palettes

datavizpyr · December 18, 2019 ·

Seaborn manual colors with set_palette()

Boxplots made with Seaborn automatically gets colors by default. Sometimes you might want to change and assign different colors to the boxes in the boxplot. For example, one might want to color boxplots with colors that are colorblind friendly. One great solution to color the … [Read more...] about Coloring Boxplots with Seaborn Palettes

Filed Under: Python, Seaborn Boxplot, Seaborn Color palette Tagged With: Color Palette, Python

How To Make Boxplots with Seaborn in Python?

datavizpyr · December 14, 2019 ·

Boxplot with Catplot Seaborn Python

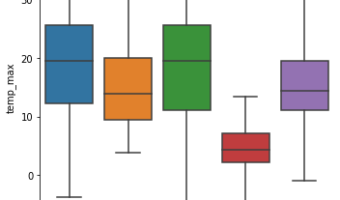
Boxplot is a way to visualize quantitative/numeric variable, in a concise way using quartiles of a data distribution. Here, we will see examples of making simple boxplots using Seaborn in Python. Let us first load packages needed for making boxplot. We will use weather … [Read more...] about How To Make Boxplots with Seaborn in Python?

Filed Under: Python, Python Boxplot, Seaborn, Seaborn Boxplot Tagged With: Boxplot, Python, Seaborn

  • « Go to Previous Page
  • Page 1
  • Page 2

Primary Sidebar

Python & R Viz Hubs

  • Seaborn Guide & Cookbook
  • ggplot2 Guide & Cookbook
  • Matplotlib Guide & Cookbook
  • Confusion Matrix Calculator
  • Visualizing Activation Functions
  • Visualizing Dropout
  • Visualizing Loss Functions

Buy Me a Coffee

Copyright © 2026 · Daily Dish Pro on Genesis Framework · WordPress · Log in

Go to mobile version