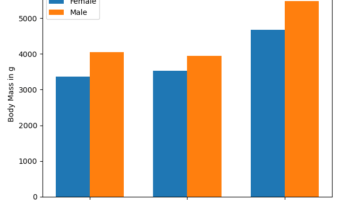
In this tutorial, we will learn how to make grouped barplot using Matplotlib in Python. We will learn how to make a gropued barplot in a realize scenario, where the data is in a Pandas dataframe and we have do some data munging to get the data to make grouped barplot. Let us … [Read more...] about How to make Grouped barplots with Matplotlib in Python
Matplotlib
How to make Stacked area plot with Matplotlib
In this tutorial, we will learn how to make a stacked area plot using Python's Matplotlib. We can make stacked area plot using matplotlib's stackplot() function. The basic syntax of using Matplotlib's stackplot() function is where x(N,) and y(M, N) array-like inputs. Data … [Read more...] about How to make Stacked area plot with Matplotlib
How to Make Heatmap with Matplotlib in Python
In this post, we will learn how to make heatmap with Matplotlib in Python. In Matplotlib, we can make heatmap with the function imshow(). imshow() basically shows the input data as image. We will start making a simple heatmap with a one-liner using imshow() first. And then … [Read more...] about How to Make Heatmap with Matplotlib in Python
How to Make Violin plots with Matplotlib
In this tutorial, we will learn how to make violin plots using Python's Matplotlib library. Matplotlib has a function called violinplot() and we will use that function to examples of making violinplot first and then learn to customize the violinplots. Unlike other tutorials … [Read more...] about How to Make Violin plots with Matplotlib
How to View All Matplotlib Plot Styles and Change
In this tutorial, we will learn how to change the background theme or style of a plot made with matplotlib. Matplotlib offers a number of ready to use styles to use for matplotlib plots. We will first learn how to find the available style options and then learn to set a … [Read more...] about How to View All Matplotlib Plot Styles and Change


