• Skip to primary navigation
  • Skip to main content
  • Skip to primary sidebar

Data Viz with Python and R

Learn to Make Plots in Python and R

  • Home
  • Python Viz
  • Seaborn
  • Altair
  • R Viz
  • ggplot2
  • About
    • Privacy Policy
  • Show Search
Hide Search

ggplot2

A mistake to Avoid while making boxplot with datapoints in ggplot2

datavizpyr · November 17, 2020 ·

Boxplots with Jittered Data points with outlier shape

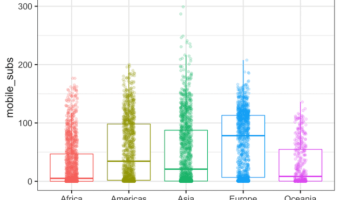
Making a boxplot with data points on top of the boxplot is a great way to show distributions of multiple groups. A big advantage is that one can see the raw data and the summary stats of distributions using boxplot with data points. ggplot2 in R makes it easy to make boxplots … [Read more...] about A mistake to Avoid while making boxplot with datapoints in ggplot2

Filed Under: ggplot boxplot outlier.shape, R, remove outlier boxplot Tagged With: ggplot2, ggplot2 Boxplot, R

How to Make Boxplot with a Line Connecting Mean Values in R?

datavizpyr · November 3, 2020 ·

Boxplot with line connecting mean values with ggplot2 in R

In this post, we will learn how to draw a line connecting the mean (or median) values in a boxplot in R using ggplot2. Connecting mean or median values in each group i.e. each box in boxplot can help easily see the pattern across different groups. The basic idea in making a … [Read more...] about How to Make Boxplot with a Line Connecting Mean Values in R?

Filed Under: Boxplot with a line connecting mean, ggplot2, R Tagged With: boxplot mean line, ggplot boxplot

How to Add Labels to Select Points with ggrepel?

datavizpyr · October 29, 2020 ·

How to add labels to select points ggrepel?

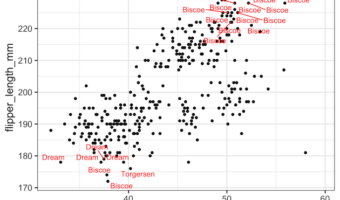
In this post, we will see how to add labels or annotations to select data points such that the labels don't overlap with each other. We will use the R package ggrepel together with ggplot to add labels without overlaps. More specifically we will use geom_text_repel() function … [Read more...] about How to Add Labels to Select Points with ggrepel?

Filed Under: add label ggrepel, R Tagged With: ggplot2, ggrepel, R

How To Rotate x-axis Text Labels in ggplot2

datavizpyr · August 31, 2020 ·

How to rotate x-axis text labels 45 degree?

One of the common problems while making data visualization is making the axis label clearly legible. Often they tend to overlap and make it difficult to read the text labels. There are a few ways we can make the axis text label easy to read. In this tutorial, we will learn … [Read more...] about How To Rotate x-axis Text Labels in ggplot2

Filed Under: ggplot2, R Tagged With: ggplot rotate axis labels

How To Make Scree Plot in R with ggplot2

datavizpyr · August 21, 2020 ·

Scree plot: barplot with geom_col()

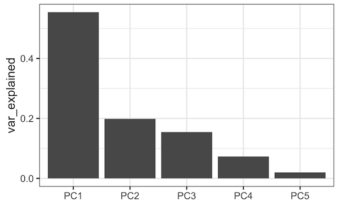
PCA aka Principal Component analysis is one of the most commonly used unsupervised learning techniques in Machine Learning. PCA on a high dimensional data can reveal the pattern or structure in the data. Scree plot is one of the diagnostic tools associated with PCA and help us … [Read more...] about How To Make Scree Plot in R with ggplot2

Filed Under: ggplot2, R, Scree plot Tagged With: PCA scree plot, scree plot R

  • « Go to Previous Page
  • Page 1
  • Interim pages omitted …
  • Page 18
  • Page 19
  • Page 20
  • Page 21
  • Page 22
  • Interim pages omitted …
  • Page 27
  • Go to Next Page »

Primary Sidebar

Tags

Altair barplot Boxplot boxplot python boxplot with jiitered text labels Bubble Plot Color Palette Countplot Density Plot Facet Plot gganimate ggplot2 ggplot2 Boxplot ggplot2 error ggplot boxplot ggridges ggtext element_markdown() Grouped Barplot R heatmap heatmaps Histogram Histograms Horizontal boxplot Python lollipop plot Maps Matplotlib Pandas patchwork pheatmap Pyhon Python R RColorBrewer reorder boxplot ggplot Ridgeline plot Scatter Plot Scatter Plot Altair Seaborn Seaborn Boxplot Stock Price Over Time Stripplot UpSetR Violinplot Violin Plot World Map ggplot2

Buy Me a Coffee

Copyright © 2025 · Daily Dish Pro on Genesis Framework · WordPress · Log in

Go to mobile version