• Skip to primary navigation
  • Skip to main content
  • Skip to primary sidebar

Data Viz with Python and R

Learn to Make Plots in Python and R

  • Home
  • Python Viz
  • Seaborn
  • Altair
  • R Viz
  • ggplot2
  • About
    • Privacy Policy
  • Show Search
Hide Search

ggplot2

How to Make Axis Text Bold in ggplot2

datavizpyr · August 26, 2021 ·

How to Make Axis Text Bold with ggplot

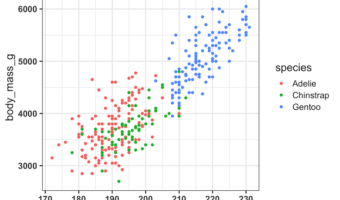
In this tutorial, we will learn how to make the axis text bold in a plot made with ggplot2 in R. Axis text in a plot refers to the text annotating the tick marks on x and y-axis. By default the axis text around tick marks are not in bold font and here we will make the axis text … [Read more...] about How to Make Axis Text Bold in ggplot2

Filed Under: ggplot2, R Tagged With: axis text bold font in R, axis text bold ggplot2

Pair plot from scratch with tidyverse

datavizpyr · July 29, 2021 ·

Pairplot with Color and Shape

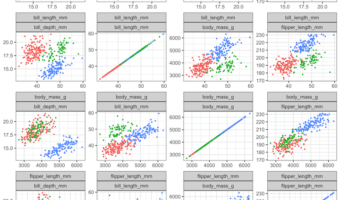
Pair plot is a simple way to quickly visualize the relationship between multiple variables in a dataframe. In this post, we will learn how to make a simple pair plot from scratch between a few quantitative/numerical variables using basic tidyverse functions. (H/T to a twitter … [Read more...] about Pair plot from scratch with tidyverse

Filed Under: ggplot2, R Tagged With: Pairplot from scratch R, Pairplot tidyverse, R Pairplot

How to Add Caption to a Plot in R

datavizpyr · July 8, 2021 ·

Customize Caption Text with element_text()

In this tutorial, we will learn how to add caption to a plot made with ggplot2 in R. Caption in R is a small text at the right corner of a plot that adds some value to the plot. We will use faithful eruption data available from built-in dataset in R. Simple plot … [Read more...] about How to Add Caption to a Plot in R

Filed Under: ggplot2, R Tagged With: add caption ggplot2, customize ggplot2 caption

How to order boxes in boxplot with fct_reorder in R

datavizpyr · July 2, 2021 ·

Reorder Boxplot in R

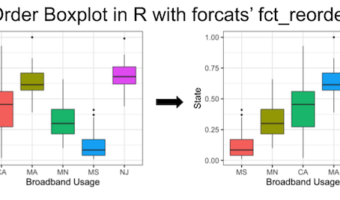
In this tutorial, we will learn how to order boxes in boxplot made with ggplot2 in R. There are a few ways to order boxes in a boxplot. Earlier, we saw how to use base R's reorder() function to order the boxes in boxplot based on the median values of another variable in the … [Read more...] about How to order boxes in boxplot with fct_reorder in R

Filed Under: ggplot2, R Tagged With: order boxes with fct_reorder, reorder boxplot ggplot

How To Make tSNE plot in R

datavizpyr · June 19, 2021 ·

tSNE Plot

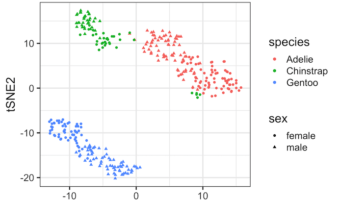
tSNE is dimensionality reduction technique suitable for visualizing high dimensional datasets. tSNE is an abbreviation of t-Distributed Stochastic Neighbor Embedding (t-SNE) and it was introduced by van der Maaten and Hinton. In this tutorial, we will learn how to perform tSNE in … [Read more...] about How To Make tSNE plot in R

Filed Under: ggplot2, R Tagged With: tSNE plot in R

  • « Go to Previous Page
  • Page 1
  • Interim pages omitted …
  • Page 13
  • Page 14
  • Page 15
  • Page 16
  • Page 17
  • Interim pages omitted …
  • Page 27
  • Go to Next Page »

Primary Sidebar

Tags

Altair barplot Boxplot boxplot python boxplot with jiitered text labels Bubble Plot Color Palette Countplot Density Plot Facet Plot gganimate ggplot2 ggplot2 Boxplot ggplot2 error ggplot boxplot ggridges ggtext element_markdown() Grouped Barplot R heatmap heatmaps Histogram Histograms Horizontal boxplot Python lollipop plot Maps Matplotlib Pandas patchwork pheatmap Pyhon Python R RColorBrewer reorder boxplot ggplot Ridgeline plot Scatter Plot Scatter Plot Altair Seaborn Seaborn Boxplot Stock Price Over Time Stripplot UpSetR Violinplot Violin Plot World Map ggplot2

Buy Me a Coffee

Copyright © 2025 · Daily Dish Pro on Genesis Framework · WordPress · Log in

Go to mobile version