• Skip to primary navigation
  • Skip to main content
  • Skip to primary sidebar

Data Viz with Python and R

Learn to Make Plots in Python and R

  • Home
  • Python Viz
  • Seaborn
  • Altair
  • R Viz
  • ggplot2
  • About
    • Privacy Policy
  • Show Search
Hide Search

ggplot2

How to Add Error Values to Barplot Labels in R with ggplot2

datavizpyr · April 14, 2022 ·

Add Error Values as Labels to Barplot w

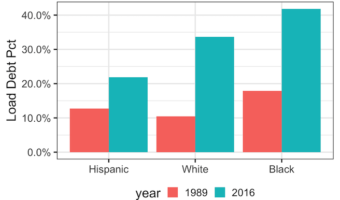
In this tutorial, we will learn how to add error values as labels on bars in a barplot. Thanks to @charliejhadley's nice tip showing how to add errors on barplot labels using str_glue() function. The main idea behind adding errors to labels is very similar to adding barplot … [Read more...] about How to Add Error Values to Barplot Labels in R with ggplot2

Filed Under: ggplot2, R Tagged With: add errors as labels to barplot in ggplot2

Bump Plot with ggbump

datavizpyr · March 28, 2022 ·

Customizing Bump Plot made with ggbump

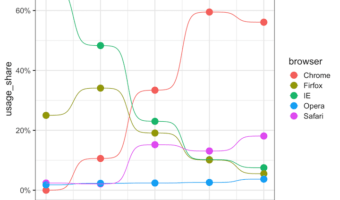
Bump plots are line plots with dots showing the data points. Bump plots can be useful in understanding the change in rank over time. In this tutorial, we will learn how to make bump plots using ggbump package, a ggplot2 extension package. To make a bump plot we will use the … [Read more...] about Bump Plot with ggbump

Filed Under: ggplot2, R Tagged With: bump plot with ggbump, ggbump ggplot2 extension

How to make UMAP plot in R

datavizpyr · January 10, 2022 ·

UMAP Plot to Identify Potential sample mix-ups

UMAP, short for "Uniform Manifold Approximation and Projection" is a one of the useful dimensionality reduction techniques like tSNE and PCA. UMAP is non-linear dimension reduction technique and often used for visualizing high-dimensional datasets. In this tutorial, we will learn … [Read more...] about How to make UMAP plot in R

Filed Under: ggplot2, R, umap plot Tagged With: umap in R, umap plot in R

How to Remove Space between Legend at Bottom and x-axis in ggplot2

datavizpyr · December 31, 2021 ·

Reduce Space between legend and x-axis: Use legend.margin()

In ggplot2, we can adjust the position of legend easily. By default, ggplot2 places the legend on the right side of a plot. Using theme() function, we can move the legend to the bottom of or top of the plot. Sometime, you might like to customize the space between legend at bottom … [Read more...] about How to Remove Space between Legend at Bottom and x-axis in ggplot2

Filed Under: ggplot2, R Tagged With: ggplot2 legend.margin, reduce space between legend and x-axis

Grouped Boxplots with reproducible jittered data points

datavizpyr · December 29, 2021 ·

Grouped Boxplots with Reproducible Jittered Data Points

In this post we will learn how to make a grouped boxplots with reproducible jittered points. We can make a grouped boxplot with jittered points using position_jitterdodge() function as position argument to geom_point(). Note that using the handy wrapper function … [Read more...] about Grouped Boxplots with reproducible jittered data points

Filed Under: ggplot2, R Tagged With: grouped boxplots with reproducible jittered points

  • « Go to Previous Page
  • Page 1
  • Interim pages omitted …
  • Page 10
  • Page 11
  • Page 12
  • Page 13
  • Page 14
  • Interim pages omitted …
  • Page 27
  • Go to Next Page »

Primary Sidebar

Tags

Altair barplot Boxplot boxplot python boxplot with jiitered text labels Bubble Plot Color Palette Countplot Density Plot Facet Plot gganimate ggplot2 ggplot2 Boxplot ggplot2 error ggplot boxplot ggridges ggtext element_markdown() Grouped Barplot R heatmap heatmaps Histogram Histograms Horizontal boxplot Python lollipop plot Maps Matplotlib Pandas patchwork pheatmap Pyhon Python R RColorBrewer reorder boxplot ggplot Ridgeline plot Scatter Plot Scatter Plot Altair Seaborn Seaborn Boxplot Stock Price Over Time Stripplot UpSetR Violinplot Violin Plot World Map ggplot2

Buy Me a Coffee

Copyright © 2025 · Daily Dish Pro on Genesis Framework · WordPress · Log in

Go to mobile version