• Skip to primary navigation
  • Skip to main content
  • Skip to primary sidebar

Data Viz with Python and R

Learn to Make Plots in Python and R

  • Home
  • Python Viz
  • Seaborn
  • Altair
  • R Viz
  • ggplot2
  • About
    • Privacy Policy
  • Show Search
Hide Search

ggplot2

ggplot2 errot: how to fix could not find function “ggplot

datavizpyr · July 7, 2022 ·

How to fix Error in ggplot(., aes... could not find function ggplot

In this post we will learn how to fix one of the most common ggplot2 errors, saying "could not find function "ggplot"" Let us consider an example where we are trying to make boxplot using iris, one of the R built-in datasets. We have been extra careful and write a … [Read more...] about ggplot2 errot: how to fix could not find function “ggplot

Filed Under: ggplot2, R Tagged With: ggplot2 error, how to fix could not find function ggplot

How to Make Grouped Violinplot with jittered data points in R

datavizpyr · July 3, 2022 ·

Grouped violin plot with jittered points using geom_sina() in ggforce

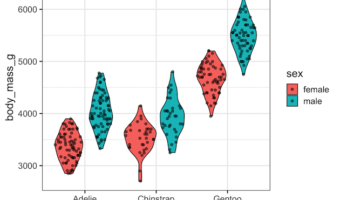
In this post, we will learn how to make grouped violin plot with jittered data points on top of it using ggplot2 in R. One of the challenges in making grouped violin or box plots with jittered data points is proper alignment of data points and the underlying plot. In an earlier … [Read more...] about How to Make Grouped Violinplot with jittered data points in R

Filed Under: geom_sina in ggforce, ggplot2, R Tagged With: Grouped violin plot with data points, Grouped violin plot with geom_sina()

How to add water mark on a ggplot

datavizpyr · May 20, 2022 ·

How to add water mark to a plot in R

In this tutorial, we will learn how to add water marks to a plot made in R. We will use ggplot2 to make the plot and use the R package cowplot to add water mark on top the plot. The cowplot package developed by Claus Wilke functions to draw with and on plots. These … [Read more...] about How to add water mark on a ggplot

Filed Under: ggplot2, R Tagged With: add water mark ggplot2

How to Reverse Order in Facet in ggplot

datavizpyr · May 15, 2022 ·

How to reverse the order of facets in R

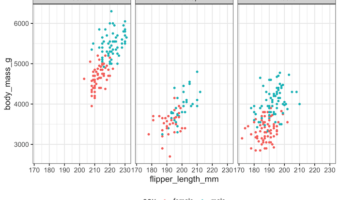
In this tutorial, we will learn how to reverse the order of facets, multiple small plots, made with ggplot2 in R. We will use R package forcats's handy function fct_rev() to reverse the order of facets made using facet_wrap() function in ggplot2. Let us load tidyverse suite of R … [Read more...] about How to Reverse Order in Facet in ggplot

Filed Under: ggplot2, R Tagged With: reverse facet order ggplot2

How to Add Colors to Axis Tick Label in ggplot2

datavizpyr · May 14, 2022 ·

How to add colors to axis tick labels using ggtext?

In this tutorial, we will learn how to add colors to axis tick labels in ggplot2. To add colors to axis labels we will use the R package "ggtext: Improved text rendering support for ggplot2" developed by Claus Wilke. Let us get started by loading the packages … [Read more...] about How to Add Colors to Axis Tick Label in ggplot2

Filed Under: ggplot2, R, Uncategorized Tagged With: add color to axis tick label, ggtext element_markdown()

  • « Go to Previous Page
  • Page 1
  • Interim pages omitted …
  • Page 9
  • Page 10
  • Page 11
  • Page 12
  • Page 13
  • Interim pages omitted …
  • Page 27
  • Go to Next Page »

Primary Sidebar

Tags

Altair barplot Boxplot boxplot python boxplot with jiitered text labels Bubble Plot Color Palette Countplot Density Plot Facet Plot gganimate ggplot2 ggplot2 Boxplot ggplot2 error ggplot boxplot ggridges ggtext element_markdown() Grouped Barplot R heatmap heatmaps Histogram Histograms Horizontal boxplot Python lollipop plot Maps Matplotlib Pandas patchwork pheatmap Pyhon Python R RColorBrewer reorder boxplot ggplot Ridgeline plot Scatter Plot Scatter Plot Altair Seaborn Seaborn Boxplot Stock Price Over Time Stripplot UpSetR Violinplot Violin Plot World Map ggplot2

Buy Me a Coffee

Copyright © 2025 · Daily Dish Pro on Genesis Framework · WordPress · Log in

Go to mobile version