Last updated on June 27, 2022
In this tutorial, we will learn how make bar plots with rounded edges in ggplot. We will use ggplot2 extension package called ggchicklet developed by the fantastic R developer boB Rudis/hrbrmstr.
Let us get started by installing ggchicklet and loading tidyverse.
remotes::install_git("https://git.sr.ht/~hrbrmstr/ggchicklet")
library(ggchicklet)
packageVersion(ggchicklet)

## [1] '0.5.2'
We have installed ggchicklet version 0.5.2. Let us quickly generate data for making a simple barplot. We use palmer penguins data set to compute average body mass per species.
df <- penguins %>%
  group_by(species) %>%
  summarize(body_mass=mean(body_mass_g, na.rm=TRUE))

df
## # A tibble: 3 × 2
##   species   body_mass
##   <fct>         <dbl>
## 1 Adelie        3701.
## 2 Chinstrap     3733.
## 3 Gentoo        5076.
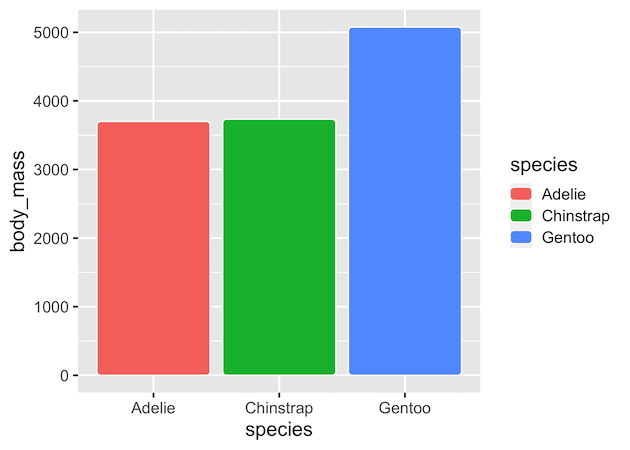
And we will this simple data and make barplot using geom_col().
df %>%
  ggplot(aes(x=species, y=body_mass, fill=species))+
  geom_col()
ggsave("barplot_ggplot.png")
As one can barplots made with ggplot2 has rectangle edges.

As Bod Rudis puts it
Sometimes it is useful to stylize column charts a bit more than just bland rectangles.
ggchicklet, a ggplot2 extension package has geom_chicklet() that makes rounded edge bars. We use default grey background to highlight the white line highlighted around the bars by ggchicklet..
df %>%
  ggplot(aes(x=species, y=body_mass, fill=species))+
  geom_chicklet()
If we are interested in making horizontal barplot with rounded bars, we can not use ggplot2 v2.3 feature of swapping x and y axes. This would give the following error.
df  %>%
  ggplot(aes(x=body_mass, y=species, fill=species))+
  geom_chicklet()
## Warning: Stacking not well defined when not anchored on the axis
## Warning: position_stack requires non-overlapping x intervals
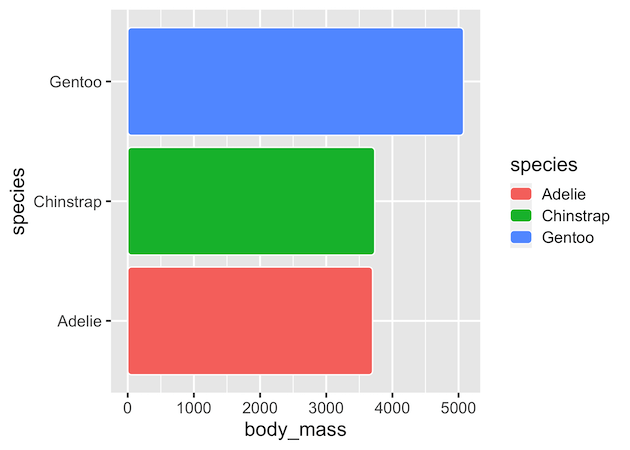
However, we can use coord_flip() to make the horizontal barplots with rounded edges.
df  %>%
  ggplot(aes(x=species, y=body_mass, fill=species))+
  geom_chicklet()+
  coord_flip()