In this tutorial, we will learn how to write a function to make a histograms using ggplot2 in R. Writing a function to create plots is useful, when you make a lot of plots, in this example, a lot of histograms.
Thanks to the upcoming 2nd edition of R for Data Science by Hadley Wickham, we have simple examples to write functions under a variety of scenarios.
Let us load tidyverse and palmerpenguin packages to make histogram
library(tidyverse)
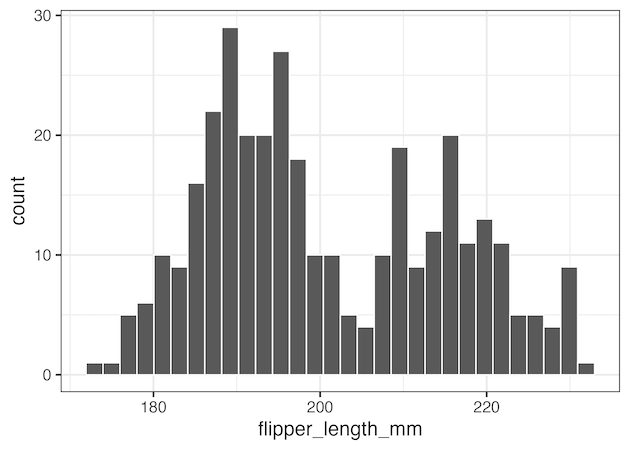
Without using a function, our code will look this to make a simple histogram.
penguins %>%
  ggplot(aes(x=flipper_length_mm))+
  geom_histogram(color="white")+
  theme_bw(16)
Plotting function for making histograms
If we have to make many histograms, we have to repeat ourselves many times. And writing a function will help us prevent repeating ourselves and thus reducing opportunities to make any mistakes.
# a simple function to make histogram
histogram <- function(df, variable){
  df %>%
    ggplot(aes({{ variable }}))+
    geom_histogram(color="white", fill="dodgerblue")+
    theme_bw(16)
}
We have basically wrapped out code to make a histogram into a function. One big thing to notice is how we refer the variable inside the function. We use {{ }} to refer the variable inside aes() function.
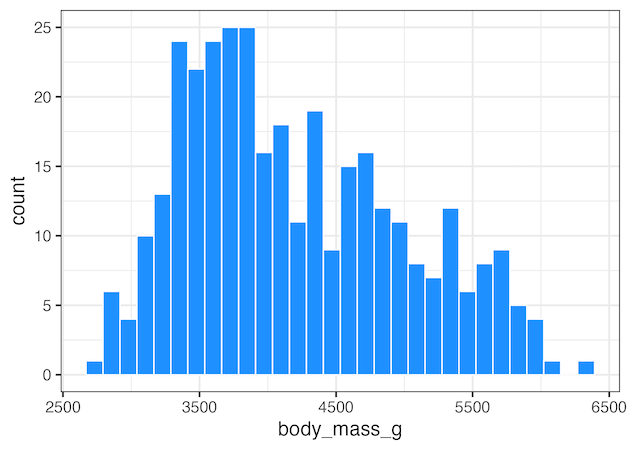
Now we can us the function to make histogram of variable of interest. Here is an example.
histogram(penguins, body_mass_g)
ggsave("ggplot_histogram_function_example1.png")
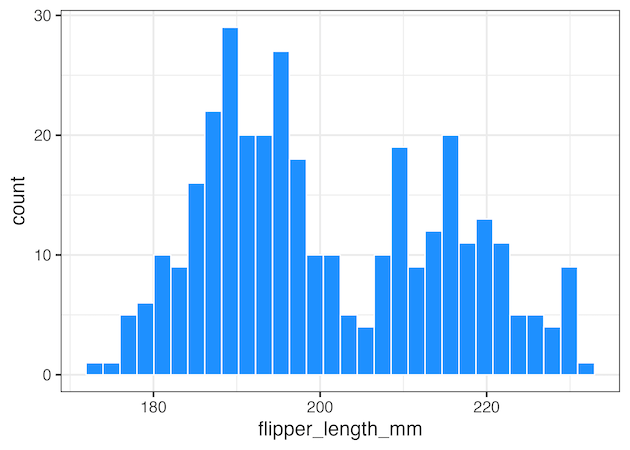
Here is another example of histogram function call with another numerical variable.
histogram(penguins, flipper_length_mm)
ggsave("ggplot_histogram_function_example2.png")
Customizing plot function for making histograms
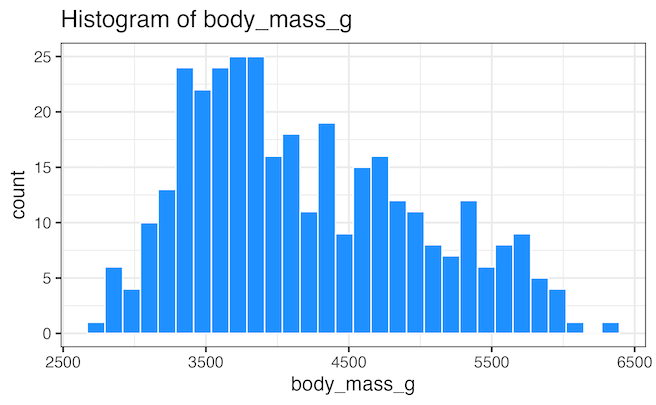
The function wee wrote to make histogram is pretty basic, we can further customise the plotting function in numerous ways. Here is one example of customising the function, where we use rlang’s eenglue() function to create a title that shows the variable name used in the histogram.
histogram <- function(df, variable){
  # text for title of the plot
  title_text <- rlang::englue("Histogram of {{variable}}")
  df %>%
    ggplot(aes({{ variable }}))+
    geom_histogram(color="white", fill="dodgerblue")+
    theme_bw(16)+
    labs(title=title_text)
}
And if we use the updated histogram with function, we will get plot with the title.
histogram(penguins, body_mass_g)
Explore the Complete ggplot2 Guide
35+ tutorials with code: scatterplots, boxplots, themes, annotations, facets, and more—tested and beginner-friendly.
Visit the ggplot2 Hub → No fluff—just code and visuals.