Last updated on September 14, 2025
By default, ggplot2 arranges facets in alphabetical order based on the factor levels of the variable you facet by. This behavior is logical but not always useful. Analysts often need to reverse or customize facet order to match reporting requirements, presentation style, or domain conventions. For example, showing “Graduate, Undergraduate, High School” rather than the default alphabetical order.
In this tutorial, you will learn multiple methods to control facet order in ggplot2 using the forcats package (fct_rev(), fct_relevel()) as well as base R factor functions. Each method is illustrated with code and plots for clarity.
Setup
We will use the palmerpenguins dataset as it is small, clean, and ideal for demonstration. The dataset contains measurements of penguin species across several islands, including flipper length and body mass. We also load the tidyverse package for plotting and data handling.
Facetting is a powerful way to create small multiples in ggplot2, allowing easy comparison across categories. In this post, we’ll facet by penguin species and progressively show how to reverse and reorder facet order. Start by loading the necessary libraries and setting a clean base theme.
library(tidyverse)
library(palmerpenguins)
theme_set(theme_bw(16))
Default Facet Order
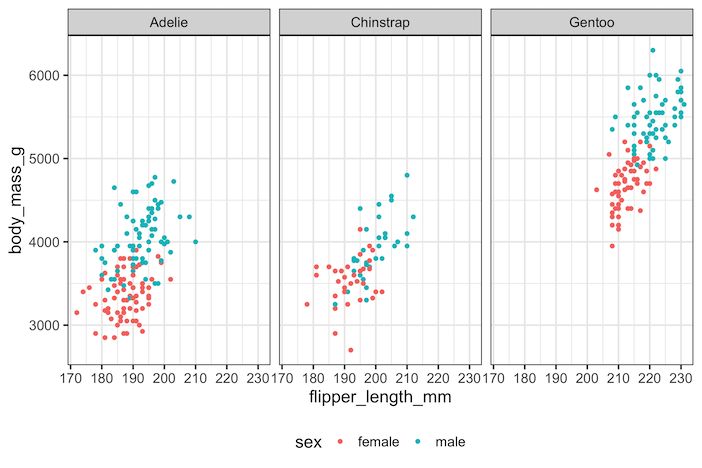
By default, when you call facet_wrap(~species) on the penguins dataset, the facets appear in alphabetical order: Adelie, Chinstrap, and Gentoo. This is because ggplot2 inherits the ordering from the factor levels of the variable.
If the factor is not explicitly ordered, R defaults to alphabetical. This may not align with the order you want for storytelling or reporting. The following plot demonstrates the default order, with three scatter plots facetted by species.
penguins |>
  drop_na() |>
  ggplot(aes(flipper_length_mm,
             body_mass_g,
             color = sex)) +
  geom_point() +
  facet_wrap(~species)+
  theme(legend.position = "bottom")
ggsave("facet_wrap_example_ggplot2.png", width=9,height=6)
Method 1: Reverse Facet Order Using forcats::fct_rev()
The simplest way to flip the order of facets is with forcats::fct_rev(). This function reverses the levels of a factor, which directly impacts facet order.
If the default is alphabetical (Adelie → Chinstrap → Gentoo), using fct_rev() produces the reverse (Gentoo → Chinstrap → Adelie).
This is a quick fix when you like the existing order but simply want it reversed, for example when reporting from largest to smallest or bottom to top. Here’s how it looks with the penguins dataset:
penguins |>
  drop_na() |>
  ggplot(aes(flipper_length_mm,
             body_mass_g,
             color = sex)) +
  geom_point() +
  facet_wrap(~fct_rev(species))+
  theme(legend.position = "bottom")
ggsave("facet_wrap_reverse_order_example_ggplot2.png", width=9, height=6)
Method 2: Manually Setting Facet Order with factor(levels=…)
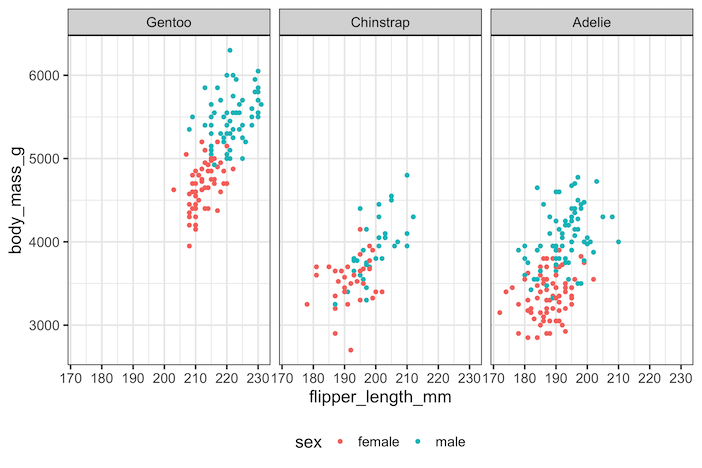
Sometimes you need more control than simply reversing the order. In these cases, you can define the exact sequence of factor levels manually using factor(..., levels=...). For example, suppose we want the order Gentoo, Chinstrap, then Adelie. By specifying levels = c("Gentoo", "Chinstrap", "Adelie"), we ensure ggplot2 facets follow this sequence.
This approach is especially useful in applied research where categories follow a natural order (e.g., income brackets, education levels) rather than alphabetical. It also makes your code reproducible across datasets, since you are not relying on default ordering.
penguins |>
  drop_na() |>
  ggplot(aes(flipper_length_mm,
             body_mass_g,
             color = sex)) +
  geom_point() +
  facet_wrap(~factor(species,
                     levels = c("Gentoo", "Chinstrap", "Adelie"))) +
  theme(legend.position = "bottom")

Method 3: Reorder Facets Flexibly Using forcats::fct_relevel()
The forcats::fct_relevel() function is more flexible than fct_rev() because it allows you to move specific levels to the front while leaving others unchanged. For instance, you might want Gentoo first, followed by Adelie, and then Chinstrap. With fct_relevel(), you can explicitly specify this order without redefining all levels manually.
Using fct_relevel() is very helpful when dealing with variables that have many categories but you only want to highlight or prioritize a few in your visualization. The example below shows how to relevel species order in a custom sequence.
penguins |>
  drop_na() |>
  ggplot(aes(flipper_length_mm,
             body_mass_g,
             color = sex)) +
  geom_point() +
  facet_wrap(~fct_relevel(species,
                         "Gentoo", "Adelie", "Chinstrap")) +
  theme(legend.position = "bottom") +
  labs(title="Reorder Facets Using forcats::fct_relevel()")
ggsave("Reorder_Facets_Using_forcats_fct_relevel.png", width=9, height=6)

Comparison of Methods
Each method has its strengths depending on your needs. fct_rev() is ideal for quick reversals when the default order is acceptable but needs flipping.
Manual factor(levels=...) gives you complete control but requires you to specify all levels, which can be tedious with many categories. fct_relevel() provides flexibility for reordering a few levels without redefining the whole factor. Together, these approaches give you a toolkit to tailor facet order in ggplot2.
FAQs
- Why does ggplot2 order facets alphabetically by default?
- Facet order follows the factor levels of the faceting variable. If a variable is not an ordered factor, R assigns levels alphabetically, and ggplot2 uses that order unless you change the levels.
- Can I control facet order separately from axis order?
- Yes. Facet order is controlled by the factor used in
facet_wrap()orfacet_grid(), while axis order is controlled by the factor mapped to x or y. Reordering one does not change the other. - How do I sort facets by the size (frequency) of each group?
- Use
forcats::fct_infreq()to reorder factor levels by their frequency in the data before faceting. Facets will then appear from most frequent to least frequent. - Can I reorder facets based on a summary statistic (e.g., mean)?
- Yes. Reorder levels using
reorder()orforcats::fct_reorder()with a summary statistic such as mean or median (e.g.,fct_reorder(species, body_mass_g, .fun = mean)). Facet order will reflect that data-driven ranking.
Explore the Complete ggplot2 Guide
35+ tutorials with code: scatterplots, boxplots, themes, annotations, facets, and more—tested and beginner-friendly.
Visit the ggplot2 Hub → No fluff—just code and visuals.


