Grouped boxplots help visualize three variables in comparison to two variables with a simple boxplot. In this post we will see how to make a grouped boxplot with jittered data points with position_jitterdodge() using ggplot2 in R.
We can make grouped boxplot without datapoints easily by using the third “grouping” variable either for color or fill argument inside aes(). However, when we try to add the layer of jittered data points on the grouped boxplot using geom_jitter(), the plot will not look good. This post shows how can we get a better grouped boxplot with jittered data points using geom_point() with position_jitterdodge() as argument.

Let u load tidyverse and palmer penguin dataset to make the grouped boxplot.
library(tidyverse)
library(palmerpenguins)
How To Make Grouped Boxplot with ggplot2?
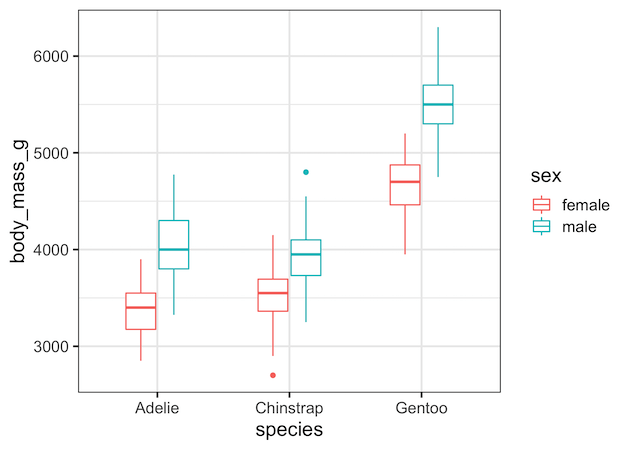
As said earlier, we can easily make a grouped boxplot in ggplot2 using geom_boxplot() and specifying the third variable as color or fill argument. In this example, we group the boxplots by the variable sex and use color option.
penguins %>%
  drop_na()%>%
  ggplot(aes(x=species,y=body_mass_g, color=sex)) +
  geom_boxplot(width=.5)

How To Make Grouped Boxplot with data points using geom_jitter()?
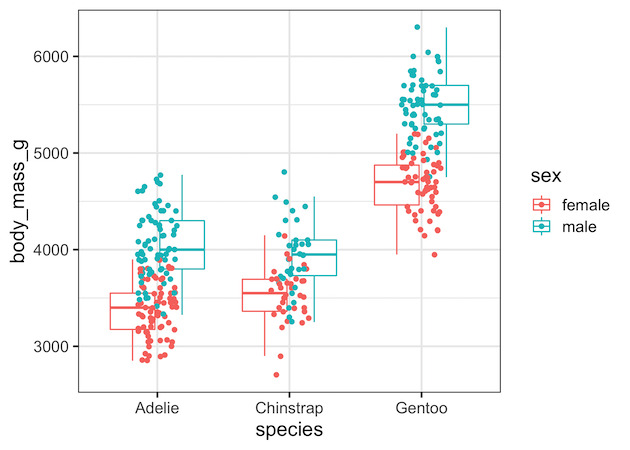
Naively, we might try to add jittered data points to the grouped boxplot using geom_jitter() function after geom_boxplot() function. geom_jitter() function is a handy shortcut for geom_point(position=”jitter”).
penguins %>%
  drop_na()%>%
  ggplot(aes(x=species,y=body_mass_g, color=sex)) +
  geom_boxplot(outlier.shape=NA)+
  geom_jitter(width=0.15)
However, this makes a grouped boxplot with overlapping boxes and data points from grouping variable.

How To Make Grouped Boxplot with jittered data points ggplot2?
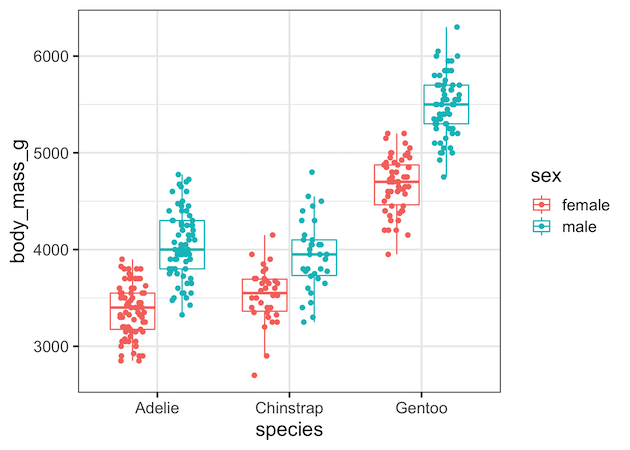
To make a better grouped boxplot with jittered data points, we can use geom_point() after geom_boxplot(). However, we use position argument, position_jitterdodge(), inside geom_point() function.
penguins %>%
  drop_na()%>%
  ggplot(aes(x=species,y=body_mass_g, color=sex)) +
  geom_boxplot(outlier.shape=NA)+
  geom_point(position=position_jitterdodge())
And we get a nice looking grouped boxplot with clearly separated boxes and jittered data within each box.

Note that we used outlier.shape=NA inside geom_boxpot() to avoid showing outlier data point two times.


