Last updated on June 18, 2021
In this post, we will learn how to order bars in a barplot using ggplot2 in R. When we make barplot with ggplot2 on a character variable it places the group in alphabetical order. Here we will learn to use two functions, reorder() from base R and fct_reorder() function from forcats package to order the barplots. We will also learn how to order the bars in ascending/descending orders.
Loading Data and Packages
Let us load the tidyverse package first. And we will use gapminder data to make barplots and reorder the bars in both ascending and descending orders. We will also set the theme for ggplot2.
library(tidyverse)
library(gapminder)
theme_set(theme_bw(base_size=16))
head(gapminder)

## # A tibble: 6 x 6
##   country     continent  year lifeExp      pop gdpPercap
##   <fct>       <fct>     <int>   <dbl>    <int>     <dbl>
## 1 Afghanistan Asia       1952    28.8  8425333      779.
## 2 Afghanistan Asia       1957    30.3  9240934      821.
## 3 Afghanistan Asia       1962    32.0 10267083      853.
Let us summarize the gapminder data to get total population per continent for the year 2007.
pop_df <- gapminder %>%
  filter(year==2007)%>%
  group_by(continent) %>%
  summarize(pop_in_millions=sum(pop)/1e06)
We get a tibble with two columns.
## # A tibble: 5 x 2
##   continent pop_in_millions
##   <fct>               <dbl>
## 1 Africa              930.
## 2 Americas            899.
## 3 Asia               3812.
## 4 Europe              586.
## 5 Oceania              24.5
Barplot using geom_col() in ggplot2
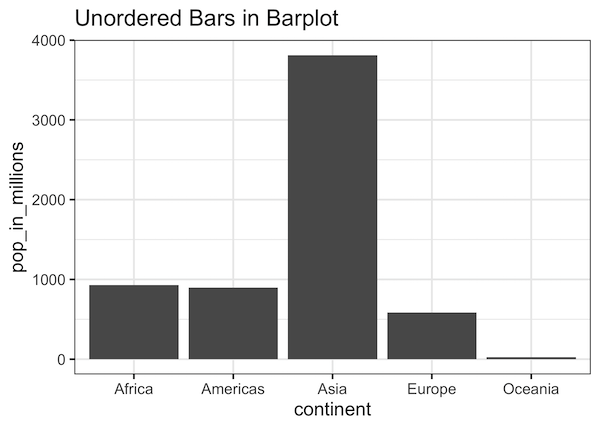
As before, we can use geom_col() function in ggplot2 to make a simple barplot. We provide the aesthetics that want to plot on x and y axes from the data and simply add geom_col() layer to it.
pop_df %>%
  ggplot(aes(continent,
             pop_in_millions))+
  geom_col() +
  labs(title="Unordered Bars in Barplot")
By default, ggplot2 uses the default factor levels and uses that as order for bars in the barplot.
How To Sort Bars in Barplot with fct_reorder?
We can re-order the bars in barplot in two ways. First, we will use the function fct_reorder() to order the continent by population size and use it order the bars of barplot. The function fct_reorder() is part of the package forcats from tidyverse, which gets loaded when we load tidyverse.
pop_df %>%
  ggplot(aes(fct_reorder(continent,
                         pop_in_millions),
             pop_in_millions))+
  geom_col() +
  labs(x="Continent", title="Ordering Barplot with fct_reorder()")
Now we have ordered the bars in barplot based on the population using fct_reorder(). With fct_reorder(), the continents/bars are re-ordered in ascending order.

How To Sort Bars in Barplot with reorder() function in base R?
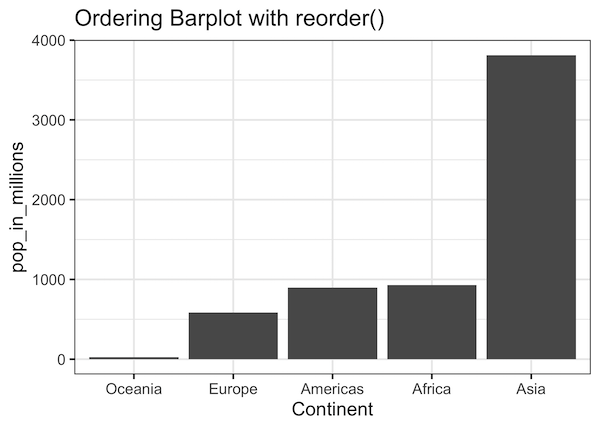
Another way to re-order barplots is to use the base R function reorder(). It kind of works the same way and we reorder the factors based on population size.
pop_df %>%
  ggplot(aes(reorder(continent,
                     pop_in_millions),
             pop_in_millions))+
  geom_col() +
  labs(x="Continent",title="Ordering Barplot with reorder()")
Reordering bars in barplot using base R function reorder() also results in the same barplot as we ordered by fct_reorder().
Note that reordering barplots with both forcats’ fct_reorder() and base R’s reorder(), ordered the bars in ascending order. Sometimes you may want to order the bars in descending order.
Here is how to order the bars of barplot in descending order based on another variable using fct_reorder() and reorder().
How To Sort Bars in Barplot in descending order?
To order bars in descending order, we can use fct_rev(), another function from forcats package. We use this to reverse the order of factors after ordering with fct_reorder().
pop_df %>%
  ggplot(aes(fct_rev(fct_reorder(continent,
                     pop_in_millions)),
             pop_in_millions))+
  geom_col() +
  labs(x="Continent",title="Reversing ordered Barplot with fct_rev()")
Now we have bars ordered in descending order.

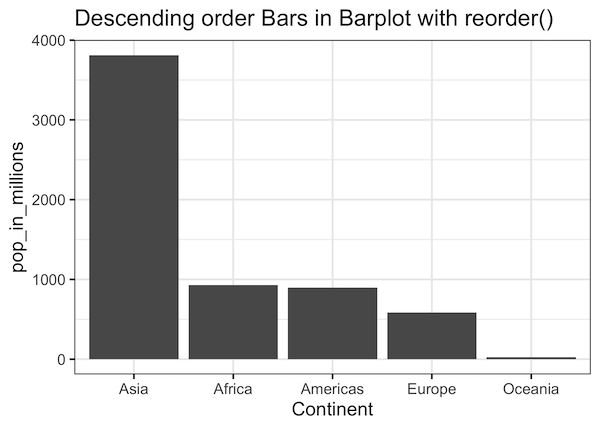
We can also use reorder to order the bars in descending order. All we need to do is to negate the variable we are ordering the bars.
pop_df %>%
  ggplot(aes(reorder(continent,
                     -pop_in_millions),
             pop_in_millions))+
  geom_col() +
  labs(x="Continent", title="Descending order Bars in Barplot with reorder()")
We get the same barplot in descending order.
Note that we can also use the negating the variable trick with fct_reorder() function instead of fct_rev() function.