In this post we will see examples of how to change axis labels, how to increase the size of axis labels and how to set title for the plot made using Seaborn in Python. These three are most basic customizations a plot needs to make it useful.
Let us load the packages we need to make the plots with Seaborn.
import seaborn as sns
import matplotlib.pyplot as plt
import pandas as pd
import numpy as np
We will generate some random data for two variables using NumPy’s random module and store them in a Pandas dataframe.
np.random.seed(31)
# Generating Data
df = pd.DataFrame({
    'height': np.random.normal(40, 15, 100),
    'weight': np.random.normal(60, 10,100),
})
Our data contains two variables; height and weight.
print(df.head())
      height     weight
0  33.778642  74.071778
1  34.999470  41.698659
2  41.216380  56.840684
3  28.134596  42.929249
4  36.721005  65.882553
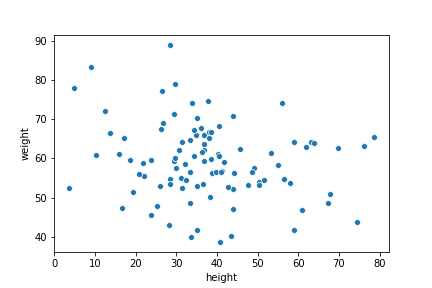
Let us make the most basic scatter plot using Seaborn’s scatterplot() function. Seaborn’s scatterplot function takes the names of the variables and the dataframe containing the variables as input.
# make scatter plot
sns.scatterplot(x="height", y="weight", data=df)
We can see that the basic scatterplot from Seaborn is pretty simple, uses default variable names as labels and the label sizes are smaller.

How To Change X & Y Axis Labels to a Seaborn Plot
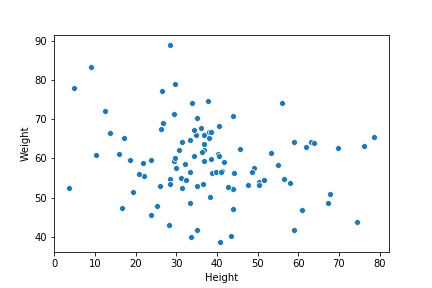
We can change the x and y-axis labels using matplotlib.pyplot object.
sns.scatterplot(x="height", y="weight", data=df)
plt.xlabel("Height")
plt.ylabel("Weight")
In this example, we have new x and y-axis labels using plt.xlabel and plt.ylabel functions.

How To Change X & Y Axis Label Size in a Seaborn Plot?
The matptplotlib.plot functions can also be used to change the size of the labels by using size as another argument.
sns.scatterplot(x="height", y="weight", data=df)
plt.xlabel("Height", size=20)
plt.ylabel("Weight", size=20)
In this example, we have changed both x and y-axis label sizes to 20 from the default size.

How To Set a Title to a Seaborn Plot?
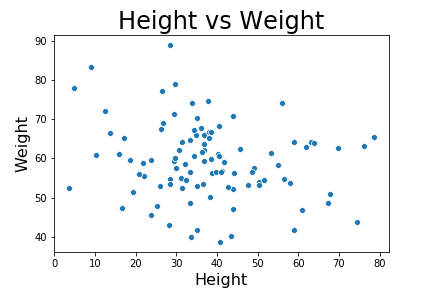
Another useful addition to a plot is to add title describing the plot. We can use plt.title() function to add title to the plot.
sns.scatterplot(x="height", y="weight", data=df)
plt.xlabel("Height", size=16)
plt.ylabel("Weight", size=16)
plt.title("Height vs Weight", size=24)
Here is how the plot looks like with increased label sizes and title for the plot.

How To Change the Size of a Seaborn Plot?
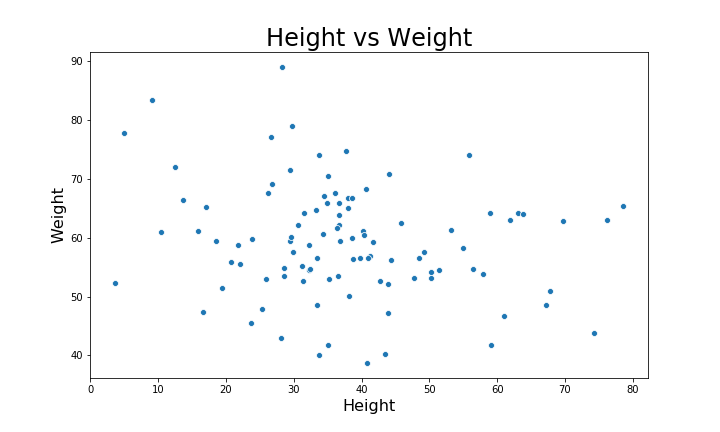
Once you have made all necessary changes to the plot and final step is to save the plot as an image of specifcied size. Often we ould like to increase the size of the Seaborn plot. We can change the default size of the image using plt.figure() function before making the plot. We need to specify the argument figsize with x and y-dimension of the plot we want.
# Increase the size of Seaborn plot
plt.figure(figsize=(10,6))
sns.scatterplot(x="height", y="weight", data=df)
plt.xlabel("Height", size=16)
plt.ylabel("Weight", size=16)
plt.title("Height vs Weight", size=24)
Now we have a plot of bigger size as we needed.


