Last updated on June 13, 2020
Legends are useful to add additional variables to a data visualization. By default, when we make a plot with legend using ggplot2, it places the legend on outside the plot on the right side.
In this post, we will learn how to change or adjust the legend position in ggplot2. We will use ggplot2’s theme() function and legend.position argument to put the legend on top of the plot, at the bottom of the plot.
Let us load tidyverse and load gapminder data for making a scatter plot with legend.
library(tidyverse)
library(gapminder)
theme_set(theme_bw(16))
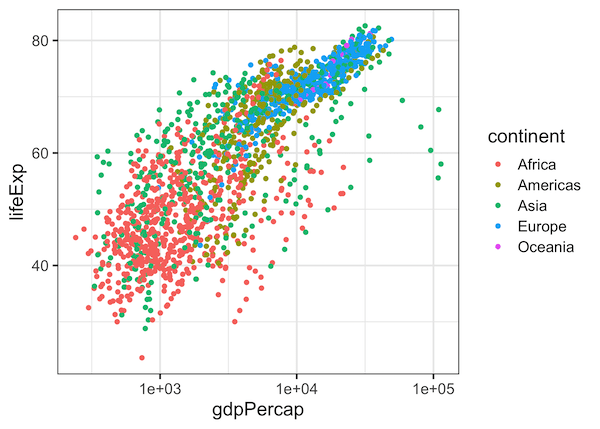
Let us first make a simple scatter plot colored by a third variable. In this example, we plot gdpPercap and lifeExp on scatter plot and color by continent.
gapminder %>%
  ggplot(aes(gdpPercap,lifeExp, color=continent)) +
  geom_point() +
  scale_x_log10()
ggsave("simple_scatter_plot_with_legend_ggplot2.png")
By default, ggplot2 makes a legend on the right hand side of the plot.
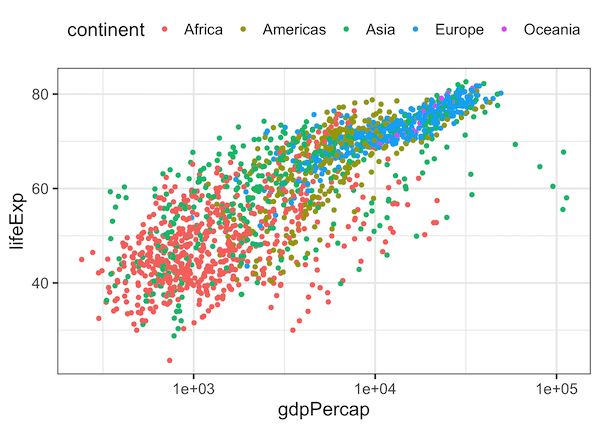
ggplot2 legend at the top
We can adjust the location of legend in ggplot2 using theme() layer with legend.position argument.
gapminder %>%
  ggplot(aes(gdpPercap,lifeExp, color=continent)) +
  geom_point() +
  scale_x_log10()+
  # place the legend at the top
  theme(legend.position = "top")
ggsave("place_legend_on_top_of_the_plot_ggplot2.png")
With legend.position=”top” option, we will get our legend on top of the plot.
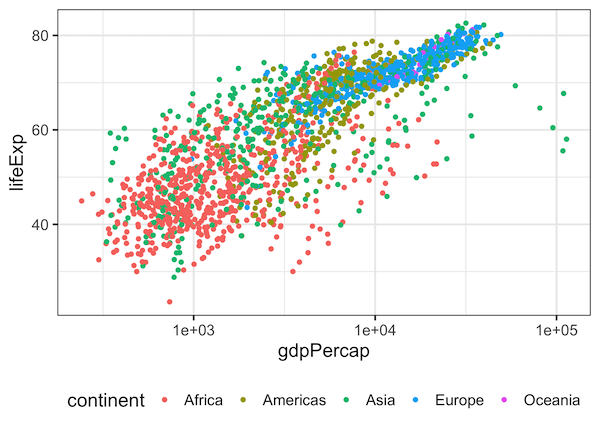
ggplot2 legend at the bottom
Similarly, with legend.position=”bottom” option, we will get our legend at the bottom of the plot.
gapminder %>%
  ggplot(aes(gdpPercap,lifeExp, color=continent)) +
  geom_point() +
  scale_x_log10()+
  # place the legend at the bottom
  theme(legend.position = "bottom")
ggsave("place_legend_on_bottom_of_the_plot_ggplot2.png")
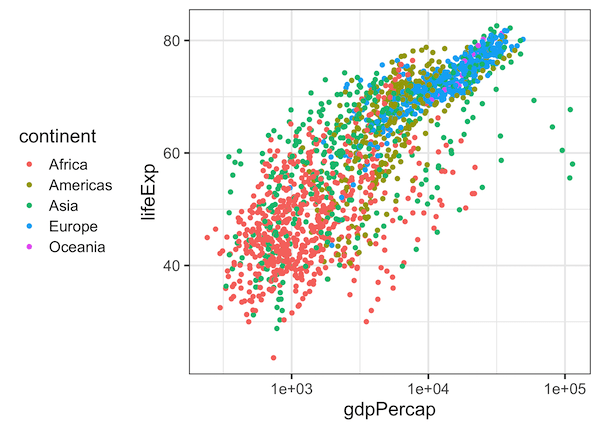
We can also place the legend on the left side of the plot, with theme(legend.position = “left”) option as shown below.
gapminder %>%
  ggplot(aes(gdpPercap,lifeExp, color=continent)) +
  geom_point() +
  scale_x_log10()+
  # place the legend on the left side
  theme(legend.position = "left")
ggsave("place_legend_on_left_side_of_the_plot_ggplot2.png")
Explore the Complete ggplot2 Guide
35+ tutorials with code: scatterplots, boxplots, themes, annotations, facets, and more—tested and beginner-friendly.
Visit the ggplot2 Hub → No fluff—just code and visuals.


