• Skip to primary navigation
  • Skip to main content
  • Skip to primary sidebar

Data Viz with Python and R

Learn to Make Plots in Python and R

  • Home
  • Seaborn
  • Matplotlib
  • ggplot2
  • Altair
  • About
    • Privacy Policy
  • Visualizing Activation Functions in Neural Networks
  • Confusion Matrix Calculator
  • Visualizing Dropout Rate in Neural Network
  • Visualizing Loss Functions in Neural Networks
  • Show Search
Hide Search

Violin Plot

How To Make Violin Plots with ggplot2 in R?

datavizpyr · February 24, 2020 ·

How To Order Horizontal Violin Plot in ggplot2?

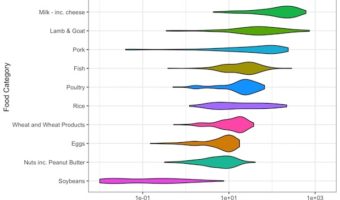
Violin plots are a way visualize numerical variables from one or more groups. Violin plots are similar to box plots. A boxplot shows a numerical distribution using five summary level statistics. Violin plots have the density information of the numerical variables in addition to … [Read more...] about How To Make Violin Plots with ggplot2 in R?

Filed Under: R, Violin plot ggplot2 Tagged With: ggplot2, R, Violin Plot

Primary Sidebar

Python & R Viz Hubs

  • Seaborn Guide & Cookbook
  • ggplot2 Guide & Cookbook
  • Matplotlib Guide & Cookbook
  • Confusion Matrix Calculator
  • Visualizing Activation Functions
  • Visualizing Dropout
  • Visualizing Loss Functions

Buy Me a Coffee

Copyright © 2026 · Daily Dish Pro on Genesis Framework · WordPress · Log in

Go to mobile version