• Skip to primary navigation
  • Skip to main content
  • Skip to primary sidebar

Data Viz with Python and R

Learn to Make Plots in Python and R

  • Home
  • Seaborn
  • Matplotlib
  • ggplot2
  • Altair
  • About
    • Privacy Policy
  • Visualizing Activation Functions in Neural Networks
  • Confusion Matrix Calculator
  • Visualizing Dropout Rate in Neural Network
  • Visualizing Loss Functions in Neural Networks
  • Show Search
Hide Search

Lower Triangular Heatmap

How To Make Lower Triangular Heatmap with Python?

datavizpyr · December 26, 2020 ·

Lower Triangular Heatmap with color palette in Python

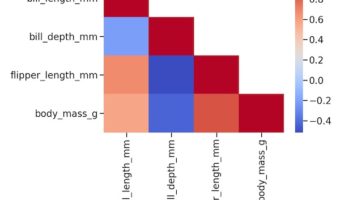
Heatmaps are a great way to quickly visualize the actual data coded as colors. Heatmaps of correlation matrix is useful to understand the relationship between multiple features or variable. However, since the correlation matrix is symmetric, it is more useful to make heatmap of … [Read more...] about How To Make Lower Triangular Heatmap with Python?

Filed Under: Heatmap Seaborn, Python Tagged With: heatmap, Lower Triangular Heatmap, Python, Seaborn

Primary Sidebar

Python & R Viz Hubs

  • Seaborn Guide & Cookbook
  • ggplot2 Guide & Cookbook
  • Matplotlib Guide & Cookbook
  • Confusion Matrix Calculator
  • Visualizing Activation Functions
  • Visualizing Dropout
  • Visualizing Loss Functions

Buy Me a Coffee

Copyright © 2026 · Daily Dish Pro on Genesis Framework · WordPress · Log in

Go to mobile version