• Skip to primary navigation
  • Skip to main content
  • Skip to primary sidebar

Data Viz with Python and R

Learn to Make Plots in Python and R

  • Home
  • Seaborn
  • Matplotlib
  • ggplot2
  • Altair
  • About
    • Privacy Policy
  • Visualizing Activation Functions in Neural Networks
  • Confusion Matrix Calculator
  • Visualizing Dropout Rate in Neural Network
  • Visualizing Loss Functions in Neural Networks
  • Show Search
Hide Search

Increase gap in boxplot Seaborn

How to increase the gap between boxes in a grouped boxplot with Seaborn

datavizpyr · September 30, 2023 ·

Increase gap between boxes in a nested boxplot with Seaborn

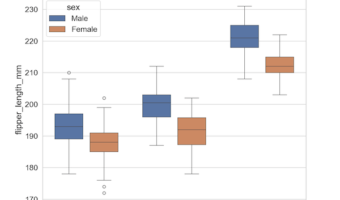
In this post we will learn how to increase the gap between boxes in a nested or grouped boxplot made with Seaborn in Python. We will use Seaborn v0.13.0 that came out in September 2023's feature to increase the gap size. Let us first load the modules/packages needed to make … [Read more...] about How to increase the gap between boxes in a grouped boxplot with Seaborn

Filed Under: Python, Seaborn Tagged With: Increase gap in boxplot Seaborn, Seaborn Boxplot

Primary Sidebar

Python & R Viz Hubs

  • Seaborn Guide & Cookbook
  • ggplot2 Guide & Cookbook
  • Matplotlib Guide & Cookbook
  • Confusion Matrix Calculator
  • Visualizing Activation Functions
  • Visualizing Dropout
  • Visualizing Loss Functions

Buy Me a Coffee

Copyright © 2026 · Daily Dish Pro on Genesis Framework · WordPress · Log in

Go to mobile version