• Skip to primary navigation
  • Skip to main content
  • Skip to primary sidebar

Data Viz with Python and R

Learn to Make Plots in Python and R

  • Home
  • Seaborn
  • Matplotlib
  • ggplot2
  • Altair
  • About
    • Privacy Policy
  • Visualizing Activation Functions in Neural Networks
  • Confusion Matrix Calculator
  • Visualizing Dropout Rate in Neural Network
  • Visualizing Loss Functions in Neural Networks
  • Show Search
Hide Search

Histogram with Seaborn objects

Histogram Tutorial with Seaborn Grammar of Graphics API

datavizpyr · October 14, 2022 ·

Seaborn Histogram with facet using Grammar of Graphics API

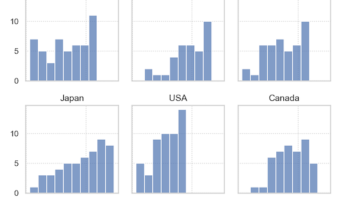
Seaborn, one of the Python data visualisation libraries had a huge update with Seaborn version 0.12.0 in September 2022. A really exciting development is new API for grammar of graphics like ggplot2. The introduction of seaborn.objects interface is the new API Taking … [Read more...] about Histogram Tutorial with Seaborn Grammar of Graphics API

Filed Under: Python, Seaborn, Seaborn objects Tagged With: Histogram with Seaborn objects

Primary Sidebar

Python & R Viz Hubs

  • Seaborn Guide & Cookbook
  • ggplot2 Guide & Cookbook
  • Matplotlib Guide & Cookbook
  • Confusion Matrix Calculator
  • Visualizing Activation Functions
  • Visualizing Dropout
  • Visualizing Loss Functions

Buy Me a Coffee

Copyright © 2026 · Daily Dish Pro on Genesis Framework · WordPress · Log in

Go to mobile version