Int his tutorial, we will see how to save a dataframe into an excel file in R. We will use the R package openxlsx to save dataframes as xlsx files. We will start with writing a single dataframe into an excel file with one sheet. Next, we will see how to save multiple dataframes into a single excel file as multiple sheets.
Let us start with load tidyverse and openxlsx to save dataframes as excel file.
library(tidyverse)
library(openxlsx)
library(palmerpenguins)
How to Write a Data Frame to an Excel file in R?
We will use palmer penguins data from palmerpenguins R package. Penguins data is available as dataframe when we load the R package.
To write a data frame into an excel file using openxlsx, we first need to create a workbook object using createWorkbook() function.
work_book <- createWorkbook()
Then we need to add work sheet to the work book using addWorksheet() function. We also provide a name for the sheet. This basically creates a empty sheet with a name.
addWorksheet(work_book, "palmerpenguins")
Now we are ready to add a dataframe to the worksheet. We use writeData() function to write dataframe as sheet in the work book we created. Here we specify the work book, sheet name and the dataframe with data to writeData() function.
writeData(work_book, "palmerpenguins",penguins )
Now our workbook has dataframe and we can write the work book as excel file using saveWorkbook() function. Here we specify work book and the excel file name.
saveWorkbook(work_book, "palmerpenguins.xlsx")
How To Save Multiple Dataframes as Multiple sheets in a single excel file?
Often one is interested in saving multiple dataframes as multiple sheets in a single excel file. We can use openxlsx to save multiple dataframes.
For this example, let us create three dataframes one for each palmer species.
adelie_df <- penguins %>%
  filter(species=="Adelie")

chinstrap_df <- penguins %>%
  filter(species=="Chinstrap")

gentoo_df <- penguins %>%
  filter(species=="Chinstrap")
First let us create a work book using createWorkbook().
work_book <- createWorkbook()
And then add three work sheets with different sheet names, one for each species.
addWorksheet(work_book, sheetName="Adelie")
addWorksheet(work_book, sheetName="Chinstrap")
addWorksheet(work_book,sheetName="Gentoo")
Now we can write multiple dataframes one by one using writeData() function with the sheet name we assigned before.
writeData(work_book, "Adelie",adelie_df )
writeData(work_book, "Chinstrap",adelie_df )
writeData(work_book, "Gentoo",adelie_df )
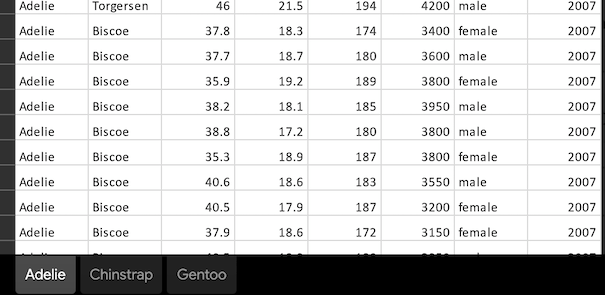
Finally, we write to excel file using saveWorkbook() with overwrite=TRUE.
saveWorkbook(work_book,
             file= "multiple_dataframes_in_single_excel_file.xlsx",
             overwrite = TRUE)


