
Violinplots are a great alternative to boxplot to visualize distribution of multiple variables. In this turtorial, we will learn about, half violin plot, a variant of violinplot in R with ggplot2. It is literally half of a violinplot, in a meaningful way. We will see examples … [Read more...] about How To Make Half Violinplot with ggplot2 in R?
8 Tips to Make Better Boxplots with Altair in Python

In this tutorial, we will learn how to make boxplot using Altair in Python. We will start with making a simple boxplot and show how we can make the boxplot better with useful Altair tips. Let us load Altair and check its version We will use Palmer Penguins dataset to … [Read more...] about 8 Tips to Make Better Boxplots with Altair in Python
How To Make Violinplot with Data Points in R?

Violinplots are a great alternative to boxplot, as it combines boxplot and density plot. In this tutorial, we will see examples of how to make violinplots with using ggplot2's geom_violin() function. Violinplots are like boxplot for visualizing numerical distributions for … [Read more...] about How To Make Violinplot with Data Points in R?
How To Remove facet_wrap Title Box in ggplot2?
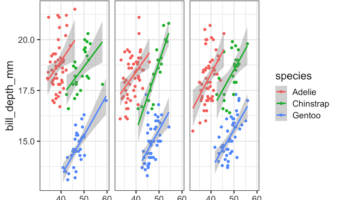
In this tutorial, we will see how to remove box surrounding title of each facets made with facet_wrap() function in ggplot2. Let us load tidyverse and set ggplot2 theme_bw() with base size 16. Let us use Palmer penguin dataset to make plots with facets using facet_wrap() in … [Read more...] about How To Remove facet_wrap Title Box in ggplot2?
Violinplot vs Boxplot: Why Violinplot Is Better Than Boxplot
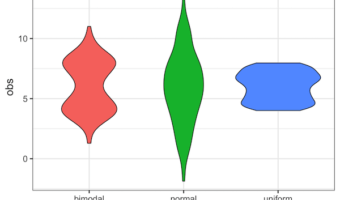
Violinplot or boxplot? What is better? Boxplots is great visualization to show a numerical variable. A boxplot shows "four main features about a variable: center, spread, asymmetry, and outliers". With the five summary statistics one can easily draw boxplot even by hand. Violin … [Read more...] about Violinplot vs Boxplot: Why Violinplot Is Better Than Boxplot