Last updated on August 22, 2025
Heatmaps are a great way to quickly visualize the actual data coded as colors. Heatmaps of correlation matrix is useful to understand the relationship between multiple features or variable. However, since the correlation matrix is symmetric, it is more useful to make heatmap of upper or lower triangular part of correlation matrix as having both is redundant.
👉 Want more? Explore the full Seaborn Tutorial Hub with 35+ examples, code recipes, and best practices.
In this post, we will learn how to make a lower triangular heatmap with data in Pandas dataframe using Numpy and Seaborn. We will use Seaborn’s heatmap function to make the lower triangular heatmap. However, the first is to make the correlation matrix upper/lower triangular.
Let us get started with loading all the Python libraries needed.
import pandas as pd
import matplotlib.pyplot as plt
import seaborn as sns
import numpy as np
We will use Palmer penguins dataset available in Seaborn’s in built datasets.
penguins = sns.load_dataset("penguins")
penguins = penguins.dropna()
In this post, we will use Pandas corr() function compute correlation matrix for all numerical variables and use NumPy functions to filter the correlation matrix to get lower triangular matrix.
First, let us compute correlation matrix of all numerical variables in the dataframe using Pandas corr() function. We get spearman correlation by specifying the argument “method” to corr() function.
corr_df = penguins.corr(method='spearman')
We can see that the correlation matrix is Symmetric.
corr_df.to_markdown()

|                   |   bill_length_mm |   bill_depth_mm |   flipper_length_mm |   body_mass_g |
|:------------------|-----------------:|----------------:|--------------------:|--------------:|
| bill_length_mm    |         1        |       -0.228626 |            0.653096 |      0.589451 |
| bill_depth_mm     |        -0.228626 |        1        |           -0.577792 |     -0.472016 |
| flipper_length_mm |         0.653096 |       -0.577792 |            1        |      0.872979 |
| body_mass_g       |         0.589451 |       -0.472016 |            0.872979 |      1        |
Our goal is to subset this symmetric correlation matrix to a matrix containing either upper or loower triangular elements. We will use a couple of very handy NumPy functions. Using, Numpy’s ones() function, we create a Numpy array containing 1’s with the same shape as our correlation matrix.
np.ones(corr_df.shape)

array([[1., 1., 1., 1.],
       [1., 1., 1., 1.],
       [1., 1., 1., 1.],
       [1., 1., 1., 1.]])
And then we use NumPy’s tril() function to get the lower triangular elements of array with all ones. Note that this has made all the upper triangular elements to zero.
np.tril(np.ones(corr_df.shape))

array([[1., 0., 0., 0.],
       [1., 1., 0., 0.],
       [1., 1., 1., 0.],
       [1., 1., 1., 1.]])
Next step is to convert this lower triangular matrix into a boolean matrix and we use astype() to convert to boolean array.
np.tril(np.ones(corr_df.shape)).astype(np.bool)

array([[ True, False, False, False],
       [ True,  True, False, False],
       [ True,  True,  True, False],
       [ True,  True,  True,  True]])
And now can use the above array and subset the correlation matrix to a lower triangular matrix
lower_triang_df = corr_df.where(np.tril(np.ones(corr_df.shape)).astype(np.bool))
Notice that the upper triangular elements are “nan” here.
lower_triang_df.to_markdown()

|                   |   bill_length_mm |   bill_depth_mm |   flipper_length_mm |   body_mass_g |
|:------------------|-----------------:|----------------:|--------------------:|--------------:|
| bill_length_mm    |         1        |      nan        |           nan       |           nan |
| bill_depth_mm     |        -0.213859 |        1        |           nan       |           nan |
| flipper_length_mm |         0.669754 |       -0.517317 |             1       |           nan |
| body_mass_g       |         0.57648  |       -0.429283 |             0.84039 |             1 |
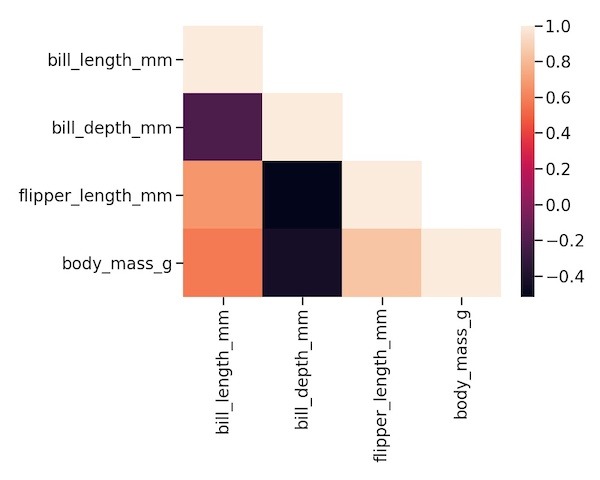
We can use Seaborn’s heatmap function with the lower triangular matrix now to make the heatmap of lower triangular correlation matrix.
sns.heatmap(lower_triang_df)
plt.tight_layout()
Customizing the heatmap with different color palette using cmap option.
sns.heatmap(lower_triang_df,cmap="coolwarm")
plt.tight_layout()