Last updated on May 23, 2021
Making a boxplot or barplot horizontally can be useful in a variety of scenarios. In ggplot2, till now the only way to make a plot horizontal is to use flip the axis using coord_flip(). With ggplot2 version 3.3.0, we can easily flip axis and make horizontal boxplot or horizontal barplot without using coord_flip().
Let us see an example of making horizontal boxplot using coord_flip() first and then use ggplot2 v3.3.0 to make horizontal plot without coord_flip().
Here we load tidyverse, the suite of R packages including ggplot2. For the first plot with coord_flip() we do not need ggplot2 version 3.3.0.
library(tidyverse)
theme_set(theme_bw(base_size = 16))
We will use tidytuesday project’s fast food data to make horizontal boxplots as before.
fast_food <- readr::read_csv("https://raw.githubusercontent.com/rfordatascience/tidytuesday/master/data/2018/2018-09-04/fastfood_calories.csv")
We will make plots using restaurants and calories variables from the fast food data.
fast_food <- fast_food %>%
  mutate(restaurant=fct_reorder(restaurant, calories))
Horizontal plots with coord_flip() in ggplot2
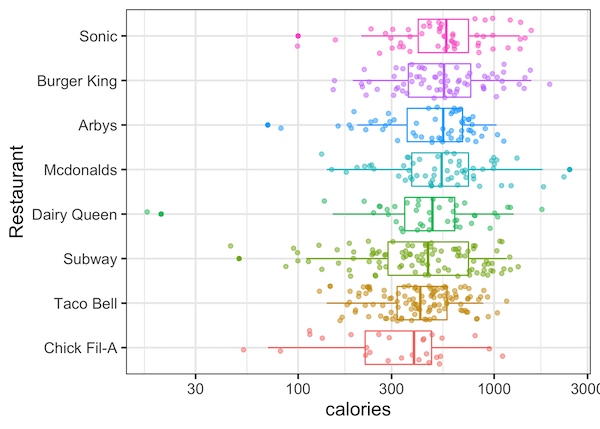
Let us first make horizontal boxplots using coord_flip(). With coord_flip() we will go ahead using ggplot2 as if we want to make regular boxplots. In this case, our x-axis is the categorical variable restaurant and y-axis is the quantitative variable calories. And finally, we will use coord_flip() to make the boxplot horizontal.
fast_food %>%
  ggplot(aes(x=restaurant, y=calories, color=restaurant)) +
  geom_boxplot()+
  geom_jitter(width=0.15, alpha=0.5)+
  scale_y_log10()+
  labs(x="Restaurant") +
  theme(legend.position="none")+
  coord_flip()
ggsave("horizontal_boxplot_with_coord_flip_ggplot2.png")
We get a horizontal boxplot using ggplot2’s coord_flip().
Horizontal plots without coord_flip() in ggplot2 version 3.3.0
Starting from ggplot2 version 3.3.0, “all the directional stats and geoms to work in both directions”. This allows us to make horizontal ggplot2 with simply switching and x and y axis instead of using coord_flip().
Let us make sure, we have ggplot2 version 3.3.0 or greater. We can check the installed package version using packageVersion() function.
packageVersion("ggplot2")
'3.3.0'
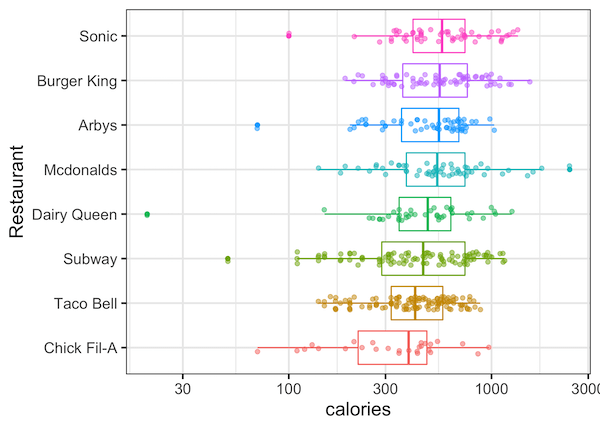
Here we have ggplot2 version 3.3.0. So we can simply swap x and y axis to make horizontal boxplot. Note we also have to specify correct axis to make log-scale. In this case, we want to have log scale on x-axis.
fast_food %>%
  ggplot(aes(x=calories,y=restaurant, color=restaurant)) +
  geom_boxplot()+
  geom_jitter(width=0.15, alpha=0.5)+
  scale_x_log10()+
  labs(y="Restaurant") +
  theme(legend.position="none")
ggsave("horizontal_boxplot_with_ggplot2_v3.3.png")
And we get a nice looking horizontal boxplot as we wanted, this time without using coord_flip(), but with the new feature ggplot2 version 3.3.0.
There seems to be a small difference in the behaviour of jitter between the two ways of making horizontal boxplots with jittered points.