• Skip to primary navigation
  • Skip to main content
  • Skip to primary sidebar

Data Viz with Python and R

Learn to Make Plots in Python and R

  • Home
  • Seaborn
  • Matplotlib
  • ggplot2
  • Altair
  • About
    • Privacy Policy
  • Visualizing Activation Functions in Neural Networks
  • Confusion Matrix Calculator
  • Visualizing Dropout Rate in Neural Network
  • Visualizing Loss Functions in Neural Networks
  • Show Search
Hide Search

Venn Diagrams

Visualizing Intersection Sets with UpSet Plot: A Replacement for Venn Diagrams

datavizpyr · February 17, 2020 ·

Highlight Multiple Specific Intersections in UpSet Plot

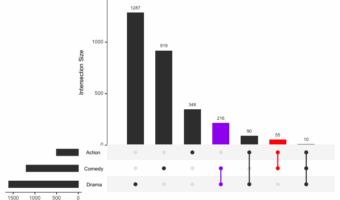
UpSet Plots in R with UpSetR: A Scalable Alternative to Venn Diagrams Venn diagrams work for up to three sets, but beyond that they become cluttered and hard to interpret. The UpSetR package solves this with UpSet plots, using a matrix layout plus bar charts to show … [Read more...] about Visualizing Intersection Sets with UpSet Plot: A Replacement for Venn Diagrams

Filed Under: R, UpSet Plot R, Venn Diagrams Tagged With: R, UpSetR

Primary Sidebar

Python & R Viz Hubs

  • Seaborn Guide & Cookbook
  • ggplot2 Guide & Cookbook
  • Matplotlib Guide & Cookbook
  • Confusion Matrix Calculator
  • Visualizing Activation Functions
  • Visualizing Dropout
  • Visualizing Loss Functions

Buy Me a Coffee

Copyright © 2026 · Daily Dish Pro on Genesis Framework · WordPress · Log in

Go to mobile version