• Skip to primary navigation
  • Skip to main content
  • Skip to primary sidebar

Data Viz with Python and R

Learn to Make Plots in Python and R

  • Home
  • Python Viz
  • Seaborn
  • Altair
  • R Viz
  • ggplot2
  • About
    • Privacy Policy
  • Show Search
Hide Search

tables with gt

6 Tips to Make Beautiful Tables with R Package gt

datavizpyr · October 20, 2020 ·

How to add colors to rows gt table?

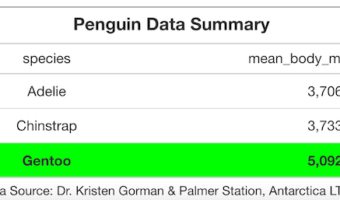
Making tables as part of your data visualization strategy can be a hit or miss. For example, a table with too many numbers screams for a plot instead of a table. Basically, challenge lies in using tables at the right time in right way. Luckily, we are in a much better position … [Read more...] about 6 Tips to Make Beautiful Tables with R Package gt

Filed Under: R, tables with gt Tagged With: ggplot2, R, tables with gt

Primary Sidebar

Tags

Altair barplot Boxplot boxplot python boxplot with jiitered text labels Bubble Plot Color Palette Countplot Density Plot Facet Plot gganimate ggplot2 ggplot2 Boxplot ggplot2 error ggplot boxplot ggridges ggtext element_markdown() Grouped Barplot R heatmap heatmaps Histogram Histograms Horizontal boxplot Python lollipop plot Maps Matplotlib Pandas patchwork pheatmap Pyhon Python R RColorBrewer reorder boxplot ggplot Ridgeline plot Scatter Plot Scatter Plot Altair Seaborn Seaborn Boxplot Stock Price Over Time Stripplot UpSetR Violinplot Violin Plot World Map ggplot2

Buy Me a Coffee

Copyright © 2025 · Daily Dish Pro on Genesis Framework · WordPress · Log in

Go to mobile version