• Skip to primary navigation
  • Skip to main content
  • Skip to primary sidebar

Data Viz with Python and R

Learn to Make Plots in Python and R

  • Home
  • Seaborn
  • Matplotlib
  • ggplot2
  • Altair
  • About
    • Privacy Policy
  • Visualizing Activation Functions in Neural Networks
  • Confusion Matrix Calculator
  • Visualizing Dropout Rate in Neural Network
  • Visualizing Loss Functions in Neural Networks
  • Show Search
Hide Search

add label ggrepel

How to Add Labels to Select Points with ggrepel?

datavizpyr · October 29, 2020 ·

How to add labels to select points ggrepel?

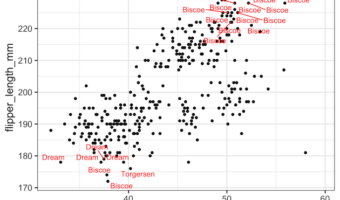
In this post, we will see how to add labels or annotations to select data points such that the labels don't overlap with each other. We will use the R package ggrepel together with ggplot to add labels without overlaps. More specifically we will use geom_text_repel() function … [Read more...] about How to Add Labels to Select Points with ggrepel?

Filed Under: add label ggrepel, R Tagged With: ggplot2, ggrepel, R

Primary Sidebar

Python & R Viz Hubs

  • Seaborn Guide & Cookbook
  • ggplot2 Guide & Cookbook
  • Matplotlib Guide & Cookbook
  • Confusion Matrix Calculator
  • Visualizing Activation Functions
  • Visualizing Dropout
  • Visualizing Loss Functions

Buy Me a Coffee

Copyright © 2026 · Daily Dish Pro on Genesis Framework · WordPress · Log in

Go to mobile version