• Skip to primary navigation
  • Skip to main content
  • Skip to primary sidebar

Data Viz with Python and R

Learn to Make Plots in Python and R

  • Home
  • Seaborn
  • Matplotlib
  • ggplot2
  • Altair
  • About
    • Privacy Policy
  • Visualizing Activation Functions in Neural Networks
  • Confusion Matrix Calculator
  • Visualizing Dropout Rate in Neural Network
  • Visualizing Loss Functions in Neural Networks
  • Show Search
Hide Search

Stripplot Seaborn Catplot

How To Make Stripplot using Seaborn Catplot?

datavizpyr · March 20, 2020 ·

Stripplot using Seaborn Catplot with long data

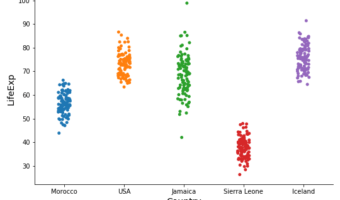
Stripplots are like scatter plots but one of the variables is a categorical variable. Stripplots are a great addition to boxplots as it shows complete data on the plot. Stripplots are more useful when can add random noise called "jitter" to avoid overlapping of data points with … [Read more...] about How To Make Stripplot using Seaborn Catplot?

Filed Under: Python, Stripplot Seaborn Catplot Tagged With: Python, Seaborn, Stripplot

Primary Sidebar

Python & R Viz Hubs

  • Seaborn Guide & Cookbook
  • ggplot2 Guide & Cookbook
  • Matplotlib Guide & Cookbook
  • Confusion Matrix Calculator
  • Visualizing Activation Functions
  • Visualizing Dropout
  • Visualizing Loss Functions

Buy Me a Coffee

Copyright © 2026 · Daily Dish Pro on Genesis Framework · WordPress · Log in

Go to mobile version