• Skip to primary navigation
  • Skip to main content
  • Skip to primary sidebar

Data Viz with Python and R

Learn to Make Plots in Python and R

  • Home
  • Seaborn
  • Matplotlib
  • ggplot2
  • Altair
  • About
    • Privacy Policy
  • Visualizing Activation Functions in Neural Networks
  • Confusion Matrix Calculator
  • Visualizing Dropout Rate in Neural Network
  • Visualizing Loss Functions in Neural Networks
  • Show Search
Hide Search

Sort Barplot Seaborn

How To Order Bars in Barplot using Seaborn in Python?

datavizpyr · March 23, 2020 ·

Sort bars in barplot descending order with Seaborn Python

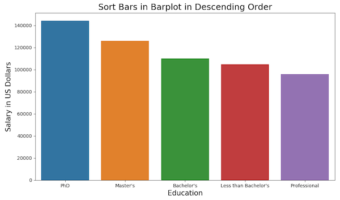
Barplots are a great way to visualize the relationship between categorical variables and their corresponding quantitative values. However, the default order of categories in Seaborn is often alphabetical, which may not be meaningful. Sorting the bars makes comparisons easier and … [Read more...] about How To Order Bars in Barplot using Seaborn in Python?

Filed Under: Python, Sort Barplot Seaborn Tagged With: barplot, Order barplot in Seaborn, Python, Seaborn

Primary Sidebar

Python & R Viz Hubs

  • Seaborn Guide & Cookbook
  • ggplot2 Guide & Cookbook
  • Matplotlib Guide & Cookbook
  • Confusion Matrix Calculator
  • Visualizing Activation Functions
  • Visualizing Dropout
  • Visualizing Loss Functions

Buy Me a Coffee

Copyright © 2026 · Daily Dish Pro on Genesis Framework · WordPress · Log in

Go to mobile version