• Skip to primary navigation
  • Skip to main content
  • Skip to primary sidebar

Data Viz with Python and R

Learn to Make Plots in Python and R

  • Home
  • Seaborn
  • Matplotlib
  • ggplot2
  • Altair
  • About
    • Privacy Policy
  • Visualizing Activation Functions in Neural Networks
  • Confusion Matrix Calculator
  • Visualizing Dropout Rate in Neural Network
  • Visualizing Loss Functions in Neural Networks
  • Show Search
Hide Search

Scatterplot change edgecolor

How To Change Edge Color on Seaborn Scatter Plot?

datavizpyr · January 31, 2021 ·

Seaborn Scatterplot: Change edgecolor and line width

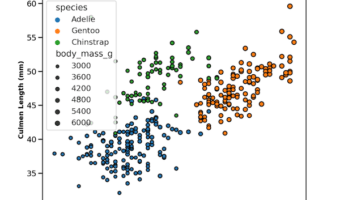
Seaborn's scatterplot function allows us to make compelling scatter plots easily. In this post we will learn how to customize edge color of a scatter plot made with Seaborn. By default, Seaborn's scatter plot function colors the markers edge color to be white. In this post, … [Read more...] about How To Change Edge Color on Seaborn Scatter Plot?

Filed Under: Python, Scatterplot change edgecolor, Seaborn, Seaborn Scatterplot Tagged With: Python, Seaborn

Primary Sidebar

Python & R Viz Hubs

  • Seaborn Guide & Cookbook
  • ggplot2 Guide & Cookbook
  • Matplotlib Guide & Cookbook
  • Confusion Matrix Calculator
  • Visualizing Activation Functions
  • Visualizing Dropout
  • Visualizing Loss Functions

Buy Me a Coffee

Copyright © 2026 · Daily Dish Pro on Genesis Framework · WordPress · Log in

Go to mobile version