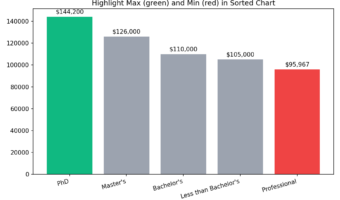
• Skip to primary navigation
  • Skip to main content
  • Skip to primary sidebar

Data Viz with Python and R

Learn to Make Plots in Python and R

  • Home
  • Python Viz
  • Seaborn
  • Altair
  • R Viz
  • ggplot2
  • About
    • Privacy Policy
  • Show Search
Hide Search

Python

Area Chart with Altair in Python

datavizpyr · February 7, 2020 ·

Area Chart with Altair in Python

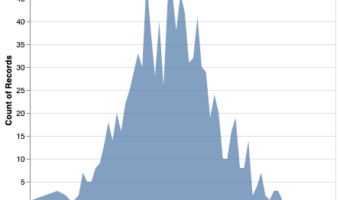
In this post, we will see how to make simple area chart with Altair in Python. Area chart displays a quantitative variable like a line plot or density plot but coloring the area under the curve. In Altair, we can make area chart with mark_area() function. Let us first load … [Read more...] about Area Chart with Altair in Python

Filed Under: Altair, Area Chart with Altair, Python Tagged With: Altair, Python

How To Make Bubble Plot in Python with Matplotlib?

datavizpyr · February 5, 2020 ·

Bubble Plot Color by Variable: Matplotlib

In this post, we will learn how to make bubbleplots using Matplotlib in Python. Bubble plot is a scatterplot, but with size of the data point on the scatter plot is coded by another variable. Basically, if the third variable is larger you get a bigger circle filled with a color … [Read more...] about How To Make Bubble Plot in Python with Matplotlib?

Filed Under: Bubble Plot Matplotlib, Matplotlib, Matplotlib Scatter Plot, Python Tagged With: Bubble Plot, Matplotlib, Python

How To Make Grouped Barplots in Python with Seaborn?

datavizpyr · February 4, 2020 ·

Grouped Barplot with Seaborn

In this tutorial, we will see examples of how to make grouped barplots using Seaborn in Python. Barcharts are great when you have two variables one is numerical and the other is a categorical variable. A barplot can reveal the relationship between them. A Grouped barplot is … [Read more...] about How To Make Grouped Barplots in Python with Seaborn?

Filed Under: Grouped Barplot Seaborn, Python, Seaborn Tagged With: Python, Seaborn

Grouped Boxplots in Python with Seaborn

datavizpyr · January 30, 2020 ·

Grouped Boxplot in Python with Seaborn

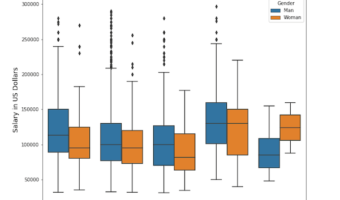
In this post, we will learn how to make grouped boxplots in Python using Seaborn's boxplot function. Grouped boxplots are a great way to visualize when you have three variables, where one of them is a numerical variable and the other two are categorical variables. Let us load … [Read more...] about Grouped Boxplots in Python with Seaborn

Filed Under: Grouped Boxplot Seaborn, Python, Seaborn Boxplot Tagged With: Boxplot, Python, Seaborn

How To Make Bubble plot with Altair in Python?

datavizpyr · January 23, 2020 ·

Bubble Plot with Filled Circle

Bubble plot is a data visualization technique that shows bubbles i.e. circles on a two dimensional plot. Bubble plot is simply a scatter plot where we plot bubbles/circles instead of points in a scatter plot. Bubble chart is useful when you have three variables and the size of … [Read more...] about How To Make Bubble plot with Altair in Python?

Filed Under: Altair, Bubble Plot Altair, Python Tagged With: Altair, Bubble Plot, Python

  • « Go to Previous Page
  • Page 1
  • Interim pages omitted …
  • Page 12
  • Page 13
  • Page 14
  • Page 15
  • Page 16
  • Interim pages omitted …
  • Page 19
  • Go to Next Page »

Primary Sidebar

Tags

Altair barplot Boxplot boxplot python boxplot with jiitered text labels Bubble Plot Color Palette Countplot Density Plot Facet Plot gganimate ggplot2 ggplot2 Boxplot ggplot2 error ggplot boxplot ggridges ggtext element_markdown() Grouped Barplot R heatmap heatmaps Histogram Histograms Horizontal boxplot Python lollipop plot Maps Matplotlib Pandas patchwork pheatmap Pyhon Python R RColorBrewer reorder boxplot ggplot Ridgeline plot Scatter Plot Scatter Plot Altair Seaborn Seaborn Boxplot Stock Price Over Time Stripplot UpSetR Violinplot Violin Plot World Map ggplot2

Buy Me a Coffee

Copyright © 2025 · Daily Dish Pro on Genesis Framework · WordPress · Log in

Go to mobile version