Last updated on August 1, 2021
In this post, we will learn how to make boxplot with data points using Altair. Latest version of Altair supports making simple boxplots. However, current version of Altair does not support adding adding jittered data points on top of boxplots. Thanks to Justin Bois from Caltech, we can use his data visualization utility package Altair-catplot, we can make boxplots with jiitered data points.
altair_catplot for making boxplots
Let us first install altair_catplot using pip install.
pip install altair_catplot
And load the needed libraries to make boxplot with data points.
import altair as alt
import altair_catplot as altcat
import pandas as pd
alt.__version__
Load Penguins data for boxplots
We will use Palmer penguins data set to show how to make boxplot with data points using Altair.
penguins_data="https://raw.githubusercontent.com/datavizpyr/data/master/palmer_penguin_species.tsv"
penguins_df = pd.read_csv(penguins_data, sep="\t")
penguins_df.head()
species	island	culmen_length_mm	culmen_depth_mm	flipper_length_mm	body_mass_g	sex
0	Adelie	Torgersen	39.1	18.7	181.0	3750.0	MALE
1	Adelie	Torgersen	39.5	17.4	186.0	3800.0	FEMALE
2	Adelie	Torgersen	40.3	18.0	195.0	3250.0	FEMALE
3	Adelie	Torgersen	NaN	NaN	NaN	NaN	NaN
4	Adelie	Torgersen	36.7	19.3	193.0	3450.0	FEMALE
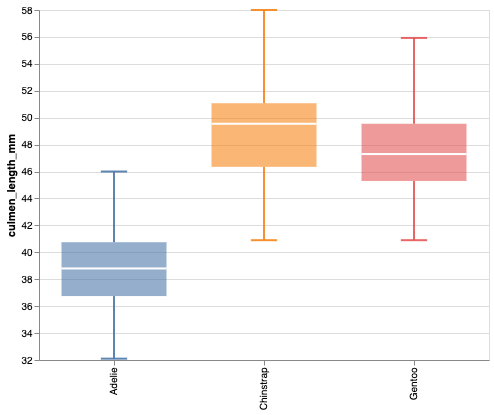
Simple Boxplot with Altair
Let us first make a simple boxplot using altair_catplot. To make simple boxplot, we specify “transform=box” with altair_catplot.
altcat.catplot(penguins_df,
               height=350,
               width=450,
               mark='point',
               box_mark=dict(strokeWidth=2, opacity=0.6),
               whisker_mark=dict(strokeWidth=2, opacity=0.9),
               encoding=dict(x=alt.X('species:N', title=None),
                             y=alt.Y('culmen_length_mm:Q',scale=alt.Scale(zero=False)),
                             color=alt.Color('species:N', legend=None)),
              transform="box")
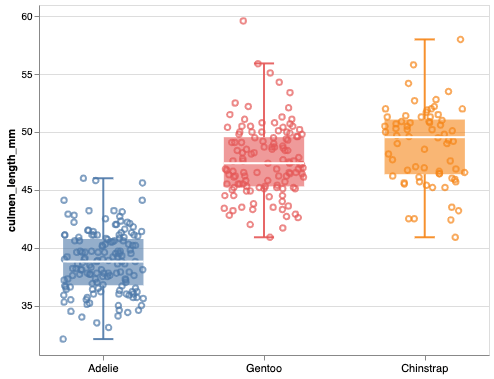
Adding jittered data points to Boxplot with Altair
To add jittered data points on top of boxplot, we use altair_catplot’s catplot() function as before. However, this time we specify transform=”jitterbox”. And we can also set width of jittered data points using “jitter_width”.
altcat.catplot(penguins_df,
               height=350,
               width=450,
               mark='point',
               box_mark=dict(strokeWidth=2, opacity=0.6),
               whisker_mark=dict(strokeWidth=2, opacity=0.9),
               encoding=dict(x=alt.X('species:N', title=None),
                             y=alt.Y('culmen_length_mm:Q',scale=alt.Scale(zero=False)),
                             color=alt.Color('species:N', legend=None)),
               transform='jitterbox',
              jitter_width=0.5)
Now we have boxplot with jittered data points using Altair.