Last updated on November 11, 2025
UpSet Plots in R with UpSetR: A Scalable Alternative to Venn Diagrams
Venn diagrams work for up to three sets, but beyond that they become cluttered and hard to interpret. The UpSetR package solves this with UpSet plots, using a matrix layout plus bar charts to show intersections precisely. This tutorial teaches the essentials using toy data and a real dataset.
Step 1: Install and Load UpSetR
Before creating plots, install and load UpSetR. If you haven’t installed it, run install.packages("UpSetR"). Then attach the library. The package provides the core upset() function and helper utilities such as fromList() for converting lists of sets into an analyzable form suitable for building the visualization quickly.
# install.packages("UpSetR")
library(UpSetR)
Step 2: Toy Data Example
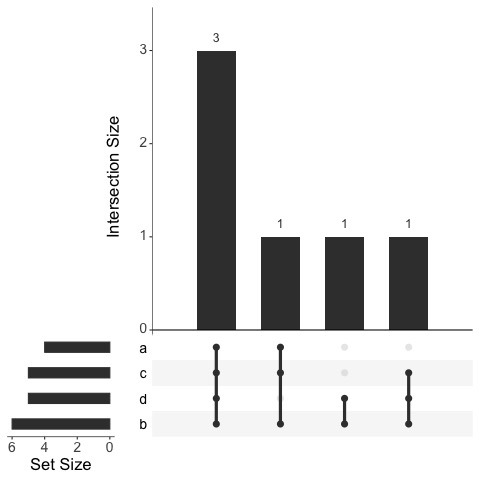
To see how UpSet plots work, start with simple synthetic sets. We create four sets (a, b, c, d) with overlapping numbers by sampling with replacement. We then collect them into a list and convert using fromList(). The result feeds into upset(), which draws intersections ordered by frequency for clarity.
set.seed(42)
a = sample(1:6, 10, replace = TRUE)
b = sample(1:6, 10, replace = TRUE)
c = sample(1:6, 10, replace = TRUE)
d = sample(1:6, 10, replace = TRUE)
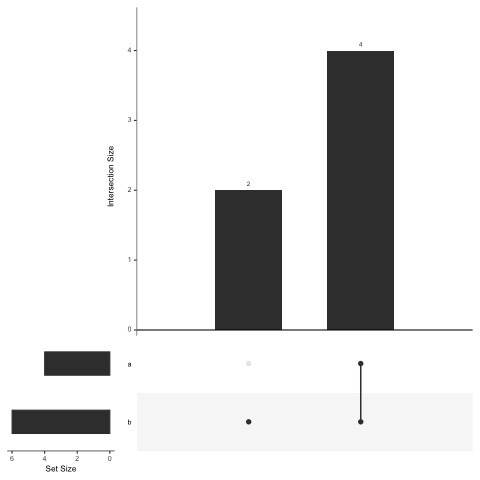
Let us consider a simple example with two sets. With Venn diagram, when we compare two sets, we will have intersection between two sets, and two numbers unique to each set.
UpSet visualizes intersections among the sets
in a matrix layout and introduces aggregates based on groupings and queries. The matrix layout enables the effective representation of associated data, such as the number of elements in the aggregates and intersections, as well as additional summary statistics derived from subset or element attributes.
list_input = list(a=a, b=b)
upset(fromList(list_input))
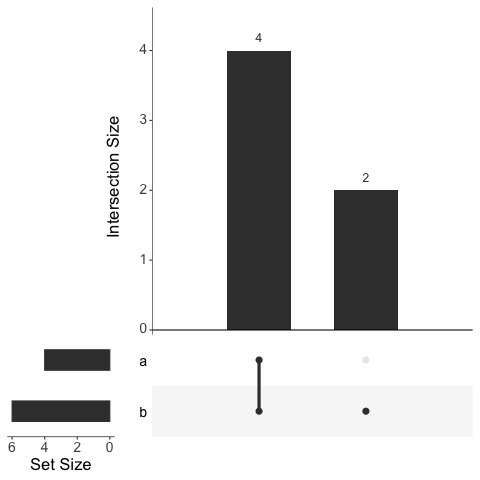
list_input = list(a=a, b=b)
upset(fromList(list_input),
      order.by = "freq",
      text.scale=2,
      point.size = 3,
      line.size = 1.5)
list_input = list(a=a, b=b, c=c, d=d)
# Visualizing_Intersection_of_Four_sets_with_upset_plot
upset(fromList(list_input),
      order.by = "freq",
      text.scale=2,
      point.size = 3,
      line.size = 1.5)
Step 3: Real Data Example (Movies)
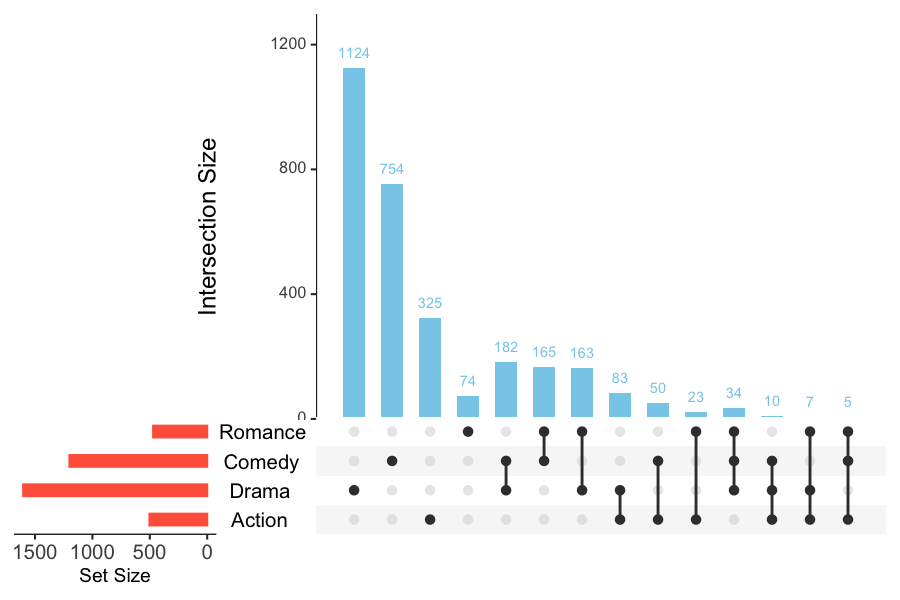
Toy examples are helpful, but real data reveals the power of UpSet plots. The movies dataset bundled with UpSetR records genre membership for each film. Because a movie can belong to multiple genres, it’s perfect for demonstrating intersections. The plot below visualizes overlaps among five common genres ordered by their intersection size.
movies = read.csv(system.file("extdata", "movies.csv", package = "UpSetR"),
                 header = T,
                 sep = ";")
png("UpSet_plot_example_with_read_data.png", width=900,
     height=600, res=140)  # open devi
upset(movies,
      sets = c("Action", "Drama", "Comedy", "Romance", "Thriller"),
      number.angles = 30,
      point.size = 3,
      line.size = 1,
      sets.bar.color = "steelblue",
      order.by = "freq")
dev.off()

Step 4: Advanced Customization
UpSetR offers multiple controls to improve readability and match publication styles. Change bar colors for sets and intersections, adjust text sizes with a six-element vector, and sort intersections by frequency or degree. keep.order preserves the set order you specify—useful when communicating domain-specific logic or a consistent narrative across figures.
png("UpSet_plot_customization_example.png", width=900, height=600, res=140)
upset(movies,
      sets = c("Action", "Drama", "Comedy", "Romance"),
      sets.bar.color = "tomato",
      main.bar.color = "skyblue",
      text.scale = c(1.5, 1.2, 1.2, 1.5, 1.5, 1.2),
      keep.order = TRUE,
      order.by = c("freq", "degree"))
dev.off()
Step 5: Highlighting Specific Intersections
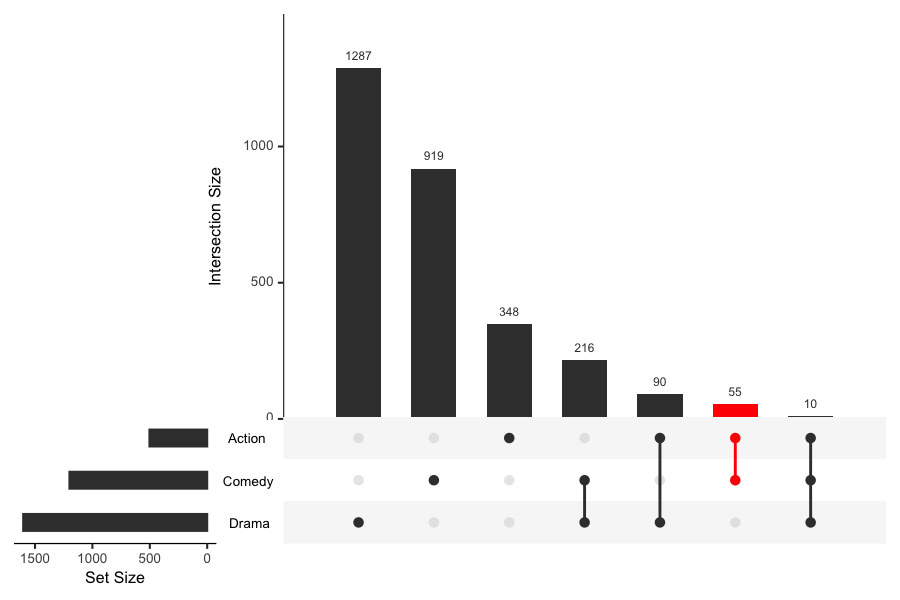
Often, only certain overlaps matter. The queries argument lets you emphasize specific intersections, such as Action ∩ Comedy. Highlighting draws attention to subsets tied to hypotheses or stakeholder questions. You can layer multiple queries with different colors, making exploratory analysis and storytelling clearer without redrawing the entire visualization.
png("UpSet_plot_highlight_specific_intersection_example.png", width=900, height=600, res=140)

upset(movies,
      sets = c("Action", "Drama", "Comedy"),
      queries = list(
        list(query = intersects,
             params = list("Action", "Comedy"),
             color = "red", active = TRUE)
      ))
dev.off()
Step 6: Highlight Multiple Specific Intersections
Highlighting intersections makes it easy to draw attention to subsets of interest. With UpSetR you can highlight more than one intersection by passing multiple queries inside the queries list. Each query specifies:
• the type of query (e.g., intersects, elements),
• which sets you want to highlight (params),
• a color,
• and whether the query should be active.
png("UpSet_plot_highlight_multiple_specific_intersections_example.png", width=900, height=600, res=140)
upset(movies,
  sets = c("Action", "Drama", "Comedy"),
  queries = list(
    list(query = intersects,
         params = list("Action", "Comedy"),
         color = "red", active = TRUE),
    list(query = intersects,
         params = list("Comedy", "Drama"),
         color = "purple", active = TRUE)
  )
)
dev.off()

Summary
- Use Venn diagrams for ≤ 3 sets; prefer UpSet plots beyond that.
-
UpSetRquickly visualizes intersections and supports helpful customizations. - Highlight key overlaps with
queriesand considerComplexUpsetfor ggplot2 workflows.